

Pipeline velocity measures how much revenue a sales pipeline produces per day. It combines four inputs: the number of qualified opportunities, average deal value, win rate and sales-cycle length. For an insurance agent or agency, it shows how fast quotes and applications turn into written premium. It also shows which of the four inputs is holding that speed back.
TL;DR
- Pipeline velocity equals (opportunities × average deal value × win rate) ÷ sales-cycle length, according to a published glossary definition.
- Four levers move it: more qualified opportunities, larger deals, a higher win rate and a shorter cycle.
- Fast follow-up is the lever most agents can change first. Leads contacted within 15 minutes reportedly close at 2 to 3 times the rate of leads contacted the next day.
- Track conversion by stage, not one agency-wide number. Stage data shows where deals stall.
- CRM automation handles follow-up, reminders and stage tracking so the metric can be measured and improved.
Table of Contents
- What pipeline velocity means
- The pipeline velocity formula
- What a good number looks like in insurance
- Diagnose slow velocity by stage
- How to improve pipeline velocity
- Where automation helps
- Perspective
- Run the metric in CallBack
- A simple monthly routine
- FAQ
- Sources
What pipeline velocity means
Pipeline velocity is the speed at which qualified opportunities move through the pipeline and convert to revenue. The result is a dollar amount per unit of time, usually per day or per month. A higher number means the pipeline produces more revenue in less time.
The metric is useful because it breaks a vague goal, “sell more,” into four parts. Each part can be measured and each can be changed on its own.
In insurance, an opportunity is a prospect who has been qualified and is moving toward a quote or application. Examples include a final expense lead who has answered a health questionnaire, a Medicare client who booked a plan review, or a mortgage protection prospect who requested a quote. Raw, unqualified leads do not belong in the count. Counting them inflates the number and hides real problems.
Pipeline velocity vs. sales velocity
The two terms are often used as synonyms. One glossary notes that pipeline velocity is often treated as sales velocity in planning.
Insurance agencies should know one difference. In agency management, sales velocity usually has a specific meaning: new business written in the current year as a percentage of prior-year commissions and fees. It is a growth measure for the whole agency, and it is considered one of the strongest indicators of organic growth and producer performance, separate from rate increases and the existing book.
Pipeline velocity is an operating measure. It looks at the flow of deals right now and points to where the flow slows. The two work together:
| Measure | What it tracks | Typical use |
|---|---|---|
| Pipeline velocity | Revenue flowing through the pipeline per day | Weekly or monthly pipeline review, finding bottlenecks |
| Agency sales velocity | New business as a percentage of prior-year commissions and fees | Annual growth benchmarking, producer evaluation |
Pipeline velocity is a planning tool. It is not a dated forecast of bookings. Its value is in the inputs: it shows where throughput is constrained, for example when larger deals come with longer cycles.
The pipeline velocity formula
The standard formula is:
Pipeline velocity = (qualified opportunities × average deal value × win rate) ÷ sales-cycle length
The definition published by Saber describes each input this way:
- Opportunities: active qualified opportunities during the period measured.
- Average deal value: the mean contract value. In insurance, most agents use annualized premium or first-year commission, and the choice must stay the same from period to period.
- Win rate: closed-won deals divided by all closed opportunities, won and lost.
- Sales-cycle length: the average number of days from opportunity creation to closed-won.
A worked example
The numbers below are illustrative, not benchmarks. Take a final expense agent with this month’s data:
- 40 qualified opportunities
- $1,800 average annualized premium per sold policy
- 25% win rate
- 45-day average sales cycle
The calculation: 40 × $1,800 = $72,000. Multiply by 0.25 for $18,000. Divide by 45 days for $400 per day of pipeline velocity.
Now change one input at a time:
| Change | New calculation | Velocity per day |
|---|---|---|
| Cycle drops from 45 to 36 days | $18,000 ÷ 36 | $500 |
| Win rate rises from 25% to 30% | $21,600 ÷ 45 | $480 |
| Opportunities rise from 40 to 50 | $22,500 ÷ 45 | $500 |
| Average premium rises from $1,800 to $2,100 | $21,000 ÷ 45 | about $467 |
A nine-day shorter cycle has the same effect as 10 more opportunities. Shortening the cycle usually costs less than buying more leads, and faster follow-up is the most direct way to do it.
What a good number looks like in insurance
No single pipeline velocity figure applies to every agent. The result depends on product, average premium and lead source. A final expense agent with small policies and short cycles will not match an agent selling indexed universal life or annuities with larger cases and longer decisions.
The most useful benchmark is your own trend. Measure the same way every month and watch the direction. Experts also warn against using one global velocity number for an entire agency. They recommend splitting it by product, territory or customer segment, because one blended figure can hide a weak area.
For agency-level context, the 2026 Best Practices Study update from Big “I” and Reagan Consulting reports that sales velocity exceeded the 12% threshold for a healthy sales culture in five of seven revenue categories. That figure uses the agency definition above, not the daily revenue formula, so it should not be compared to the pipeline velocity number directly.
Diagnose slow velocity by stage
When velocity is low, the formula tells you which input is weak. Stage data tells you why.

Insurance producers should track stage conversion rates, lead response time and activity volume. One producer metrics guide gives a useful example. If 80% of discovery calls become proposals but only 15% of proposals close, the problem is likely targeting, qualification or the presentation itself.
Track these at minimum:
- Stage-to-stage conversion: lead to contact, contact to quote, quote to close. Each stage often reveals its own process leak.
- Average days in stage: shows where deals wait the longest.
- Stale opportunities: deals with no activity for a set number of days. Stage-based tracking can include this alongside close rate by lead source.
- Close rate by source: separates lead-quality problems from producer-activity problems.
- Lead response time: the gap between a lead arriving and the first real contact.
For telephone-driven insurance sales, one source lists reference points for a well-managed operation: a 60 to 80% contact rate, a 60 to 75% quote rate and a 25 to 40% quote-to-bind close rate. These come from a trade blog, so treat them as rough reference points and compare against your own history first.
Define each stage clearly
Measurement fails when stages are vague. A good pipeline has clear entry and exit criteria for every stage. For example, “Contacted” should mean a completed two-way conversation, not just a logged attempt. If attempts count as contacts, cycle length looks shorter than it is and conversion looks better than it is.
A simple insurance pipeline might use these stages:
- New lead
- Contacted (two-way conversation completed)
- Needs review or appointment set
- Quote or proposal sent
- Application submitted
- Issued or closed-won
- Closed-lost, with a reason code
For a longer build-out, see the guide to pipeline management for insurance, which lays out a 30/60/90 day plan.
How to improve pipeline velocity
Each lever in the formula has practical actions behind it.
Increase qualified opportunities
More volume helps only if the leads are qualified. Set a clear definition of a qualified opportunity for each product line and apply it consistently. Then add volume from sources that close well, which close rate by source will show. For ideas on filling the top of the pipeline, see how to automate lead generation for insurance agents and the lead generation workflow tutorial.
Raise average deal value
Average deal value rises when agents review the full household need. Examples include adding a rider, pairing mortgage protection with a final expense policy, or offering a bundled home and auto review. Proposals that are clear and quick to sign also help. Avoid discounting to speed a close, since it lowers the value input and may offset the gain.
Improve win rate
Win rate improves with better qualification and consistent follow-up. Agents can improve sales velocity by researching prospects, tracking metrics, following up, using CRM or automation tools and moving on from leads that will not pan out. The same source notes that up to 80% of sales take five follow-up calls, so a single attempt leaves most of the available business untouched.
A “break-up” message or call is a practical final step. It clears the pipeline and prompts a prospect to answer or decline. Closing out dead deals also keeps the opportunity count honest.
Shorten the sales cycle
The cycle is usually the easiest input to move. Most delay comes from waiting: a lead sits uncontacted, a quote sits unanswered, an application sits unsigned. Use these steps:
- Respond to new leads in minutes, not hours. The 15-minute finding cited above shows what the delay costs.
- Set a follow-up sequence for each stage with a fixed number of touches over fixed days.
- Send proposals with a next step and a date attached.
- Review stale deals weekly and either act or close them.
- Use text, email and voicemail together, since prospects respond on different channels.
Strong lead nurturing supports each of these steps. A guide to lead nurturing strategies that lift conversions covers the approach in more general terms.
Where automation helps
Most manual work in a pipeline is repetitive: data entry, reminders, follow-up messages, stage updates. Doing it by hand is slow and inconsistent, and the metrics suffer because data is missing. Automation addresses this in three ways.
- Speed: a new lead can receive an instant text or email and be assigned to an agent immediately.
- Consistency: every lead gets the same follow-up sequence, including the fourth and fifth touch that agents often skip.
- Clean data: stage changes and activity are logged automatically, so velocity and conversion numbers can be trusted.
The guides on sales pipeline automation, how to automate follow-ups and an insurance sales automation workflow explain the setup in detail. For quotes that go quiet, the five-part proposal follow-up is a ready pattern.
Perspective
Most agents we talk to track premium written and leads bought. Few track how many days a deal sits in each stage. That is where velocity is lost.
We built CallBack for insurance sales, so the pipelines, follow-up and automation start from insurance workflows instead of a generic template. Our aim is to remove manual steps: data entry, lead scoring, reminders and outreach. Agents then spend their time on conversations with people who are ready to talk.
We also believe cold calling alone is an outdated way to fill a pipeline. Automated follow-up by text, email and voicemail, plus AI assistants that help identify higher-value prospects, can shorten the cycle and raise the win rate. Both of those inputs sit in the velocity formula.
Our advice: pick one product line, define its stages, and measure days in stage for a month. Then automate the slowest step first.
Kyle
Run the metric in CallBack
CallBack is a CRM and sales automation platform for insurance agents, agencies and IMOs. It includes pipeline management, automated follow-up by SMS, email and voicemail, workflow automation, AI assistants, reporting and mobile access in one system. The CRM features page describes the pipeline tools.
Published pricing on the site is $97 per month for the Professional plan. Enterprise plans cost $297 per month for 10 full CRM accounts, $397 per month for 25 accounts and $497 per month for 60 accounts. An Unlimited AI Employee Bundle is listed at $127 per month, and phone numbers are $2.30 per month each. Usage for SMS, email and AI is billed at wholesale rates, and the fees page has the details.
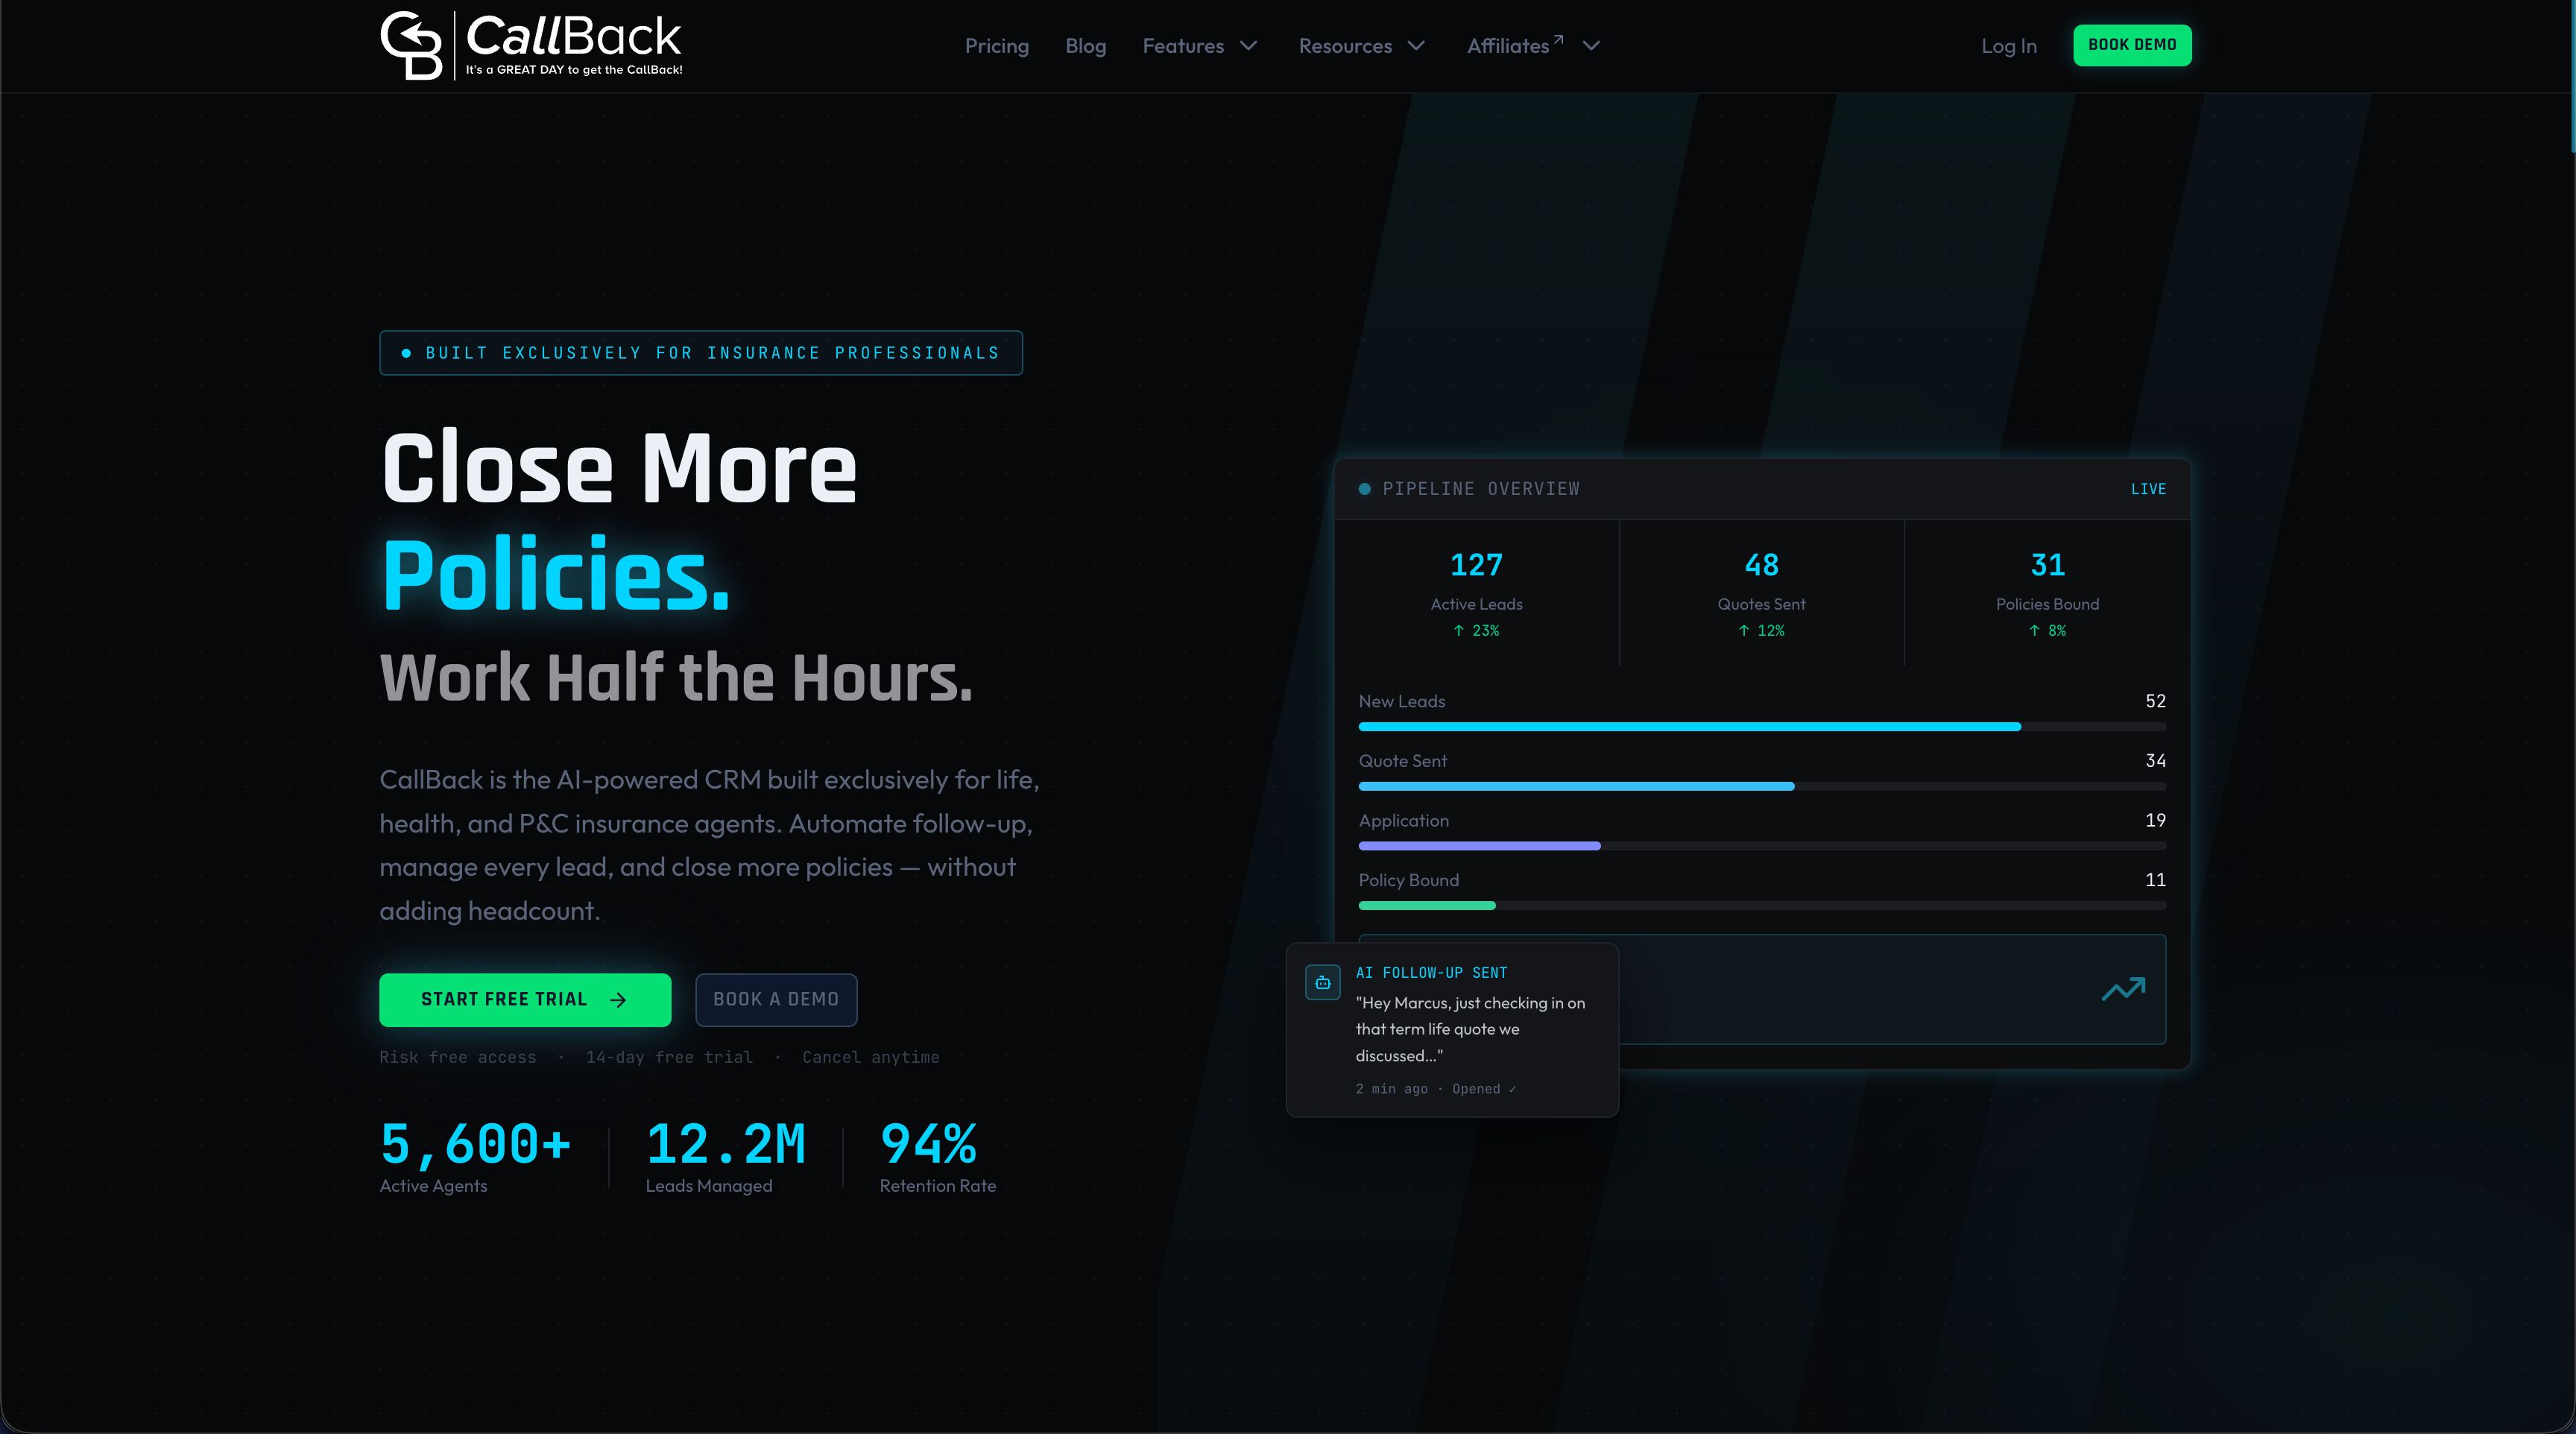
Agents who want to test it on their own pipeline can start from the CallBack homepage.
A simple monthly routine
A short routine keeps the metric useful.
- Week 1: Export or view the previous month’s data. Calculate the four inputs for each product line.
- Week 2: Find the weakest stage by conversion and by days in stage.
- Week 3: Change one thing in that stage, such as a faster first response or a new follow-up sequence.
- Week 4: Review stale deals, close the dead ones, and recalculate.
Change one input at a time. If several change together, the result cannot be traced to a cause.
Agencies can also watch producer development. The same Best Practices study notes that top agencies keep investment in producer recruitment and development at 1.5% to 2.0%, a reminder that people and process both drive velocity.
FAQ
What is pipeline velocity?
Pipeline velocity is the revenue a sales pipeline generates per day, based on the number of qualified opportunities, average deal value, win rate and sales-cycle length. A higher figure means deals are closing faster or in greater value. It is mainly a tool for finding which part of the pipeline to fix.
How do you calculate pipeline velocity?
Multiply qualified opportunities by average deal value and by win rate. Then divide by the average number of days in the sales cycle. For example, 40 opportunities at $1,800 with a 25% win rate and a 45-day cycle gives $400 per day.
What is a good sales velocity for an insurance agency?
It depends on the definition. For agency-level sales velocity, new business as a percentage of prior-year commissions and fees, the 2026 Best Practices Study update uses 12% as the threshold for a healthy sales culture. For daily pipeline velocity, compare against your own past results by product line.
How can I improve sales velocity quickly?
Start with response time and follow-up. Contact new leads within minutes, set a fixed multi-touch sequence, and close out stale deals. Automating these steps in a CRM keeps them consistent without adding daily work.
Sources
- Pipeline Velocity (Saber glossary)
- Pipeline Velocity (Chief glossary)
- Sales Velocity: What Is It & How Do You Grow It? (MarshBerry)
- Big “I” and Reagan Consulting Release 2026 Best Practices Study Update
- Insurance Sales Pipeline Management (Nationwide Agent Blog)
- The 7 Pipeline Metrics Every Insurance Producer Should Track
- The TeleFunnel Metrics That Tell You What’s Working
- Insurance Sales Pipeline Stages: A Practical CRM Framework
- How Many Follow Ups Should We Be Making On Insurance Quotes?