

Treat customer journey mapping insurance programs as an ongoing operating discipline, not a one-time workshop. Map the handoffs that generate the most repeat contact first, since those points drive the biggest share of friction. Insurance teams that operationalize journey management see the payoff J.D. Power and McKinsey both document: lower cost-to-serve, higher digital conversion, and fewer dropped handoffs. Tools like CallBack CRM exist specifically to turn those map findings into triggered action.
TL;DR:
- Focusing on fixing routine stages like billing accuracy and renewal notices yields significant improvements in customer satisfaction and operational efficiency.
- Mapping should prioritize high-repeat-contact points, such as claims status and onboarding, and turn findings into automated triggers managed continuously.
- Impactful fixes are those with high customer or revenue impact and low effort, such as messaging improvements or claim notification triggers, ranked first for quick ROI.
- AI and machine learning enable predictive interventions and real-time adjustments, transforming journey maps into living, data-driven workflows.
- Successful journey management requires ongoing governance, a clear owner, and starting with small, measurable pilots before scaling across the organization.
Table of Contents
- What Are the Stages of the Insurance Customer Journey?
- How Do You Map the Insurance Customer Journey Step by Step?
- How Do You Prioritize Journey Pain Points?
- What KPIs Prove Journey Mapping ROI?
- Which Tools and Integrations Actually Run the Journey?
- What Mistakes Derail Insurance Journey Mapping Projects?
- A Quick-Win Example: Fixing Claims Status Confusion
- What Compliance Rules Affect Insurance Journey Mapping?
- How Should Customer Feedback and Data Privacy Shape the Map?
- How Do You Personalize the Insurance Customer Journey?
- How Are AI and Machine Learning Changing Insurance Journey Mapping?
- Why I Push Insurers to Start Small and Govern Relentlessly
- How CallBack CRM Helps You Run the Journey, Not Just Map It
- Sources
What Are the Stages of the Insurance Customer Journey?
The insurance customer journey breaks into six recognizable stages: awareness, shopping and research, buying or binding, using the policy, filing a claim, and renewing or expanding coverage. Each stage carries its own customer goal, and mapping them separately keeps a project from turning into a vague, one-size-fits-all diagram.
During awareness and research, customers compare options and expect transparency. J.D. Power found that price comparison tools nearly double purchase likelihood compared to when none are available, yet a significant share of shoppers never encounter one. This gap alone justifies a mapping project focused only on the shopping stage.
Buying and binding is where channel preference splits sharply. McKinsey reports that a majority of customers still want a human for complex purchases or coverage disputes, even though close to half prefer digital self-service for routine research and account changes. A map that assumes digital-first for every stage will misfire here.
Claims remain the moment of truth. It’s the stage where trust is won or lost, and where uncertainty drives the most repeat contact. But the stages that quietly shape long-term perception are the routine ones: billing accuracy, renewal notices, and how clearly a portal explains a rate change. Watermark Consulting’s research ties sustained CX improvement to stronger financial returns, and much of that improvement comes from fixing these unglamorous, high-frequency touchpoints rather than the dramatic ones.
A useful stage breakdown for mapping purposes looks like this:
- Awareness: customer identifies a need, often triggered by a life event or renewal notice from a competitor.
- Shopping/research: customer compares carriers, pricing, and coverage, frequently across three or more sites before contacting an agent.
- Buy/bind: customer completes underwriting questions and finalizes a policy, with channel choice depending on complexity.
- Use/service: customer manages billing, makes minor changes, or checks coverage details.
- Claim: customer files and tracks a claim, generating the highest emotional stakes and the most support contacts.
- Renew/grow: customer reviews pricing at renewal and considers additional coverage.
Map each stage against the channels customers actually use there, not the channels your organization wishes they used.
How Do You Map the Insurance Customer Journey Step by Step?
A journey map only earns its keep when it turns into a repeatable process, not a poster from a single workshop. Here’s the sequence that produces maps insurance teams actually use.
- Build personas from real data, not assumptions. Pull segmentation attributes from policy administration systems, call center transcripts, and web analytics: age band, product line, digital engagement level, and claim history all matter more than generic demographic guesses. Insurers with strong data hygiene often find three to five personas cover 80% of their book.
- Inventory every touchpoint and its owner. List each channel (call center, agent, portal, app, SMS, mail) and tie every touchpoint to the internal system and team that owns it. A touchpoint with no clear owner is where handoffs quietly break.
- Capture emotion alongside hard metrics. Pair qualitative signals like frustration during a claims call with quantitative ones: session drop-off rates, IVR repeat-call frequency, and portal abandonment at specific steps. Emotion tells you where it hurts; metrics tell you how much it costs.
- Prioritize map findings into experiments. Every friction point identified should become a testable pilot with a named owner and a deadline, not a bullet on a slide that never gets revisited.
- Operationalize the fixes. Convert validated experiments into detection rules, automated triggers, service-level agreements, and dashboards that run continuously. This is the step most teams skip, and it’s the one that separates a map from Customer Journey Management.
Pro Tip: Start your first pilot on the journey with the highest repeat-contact rate, usually claims status. It’s the fastest way to prove ROI to skeptical stakeholders before scaling to other journeys.
A structured outreach workflow built around these steps gives agents a template rather than a blank page every time a new journey needs mapping.
How Do You Prioritize Journey Pain Points?
Not every friction point deserves equal attention. Score each identified issue on two axes: impact on the customer (or revenue at risk) and effort required to fix it. High-impact, low-effort fixes go first; high-impact, high-effort items become roadmap projects; low-impact items get parked.
Behavioral signals make the scoring objective instead of political. Repeat calls on the same claim number, portal abandonment at a specific form field, and low CSAT scores tied to a particular touchpoint all point to where the value is actually leaking.
A short triage example illustrates the method:
- Claims communications: repeat calls spike when status updates lag more than 48 hours; fix ranks high-impact, low-effort since it’s a messaging trigger, not a system rebuild.
- Billing notices: confusing rate-change language drives service calls at renewal; medium-impact, low-effort since copy and formatting changes are fast to test.
- Portal onboarding: high abandonment during account setup signals a UX problem; high-impact, but often high-effort if it requires a platform change.
Rank by customer-value-at-risk first, not by which department complains loudest.
What KPIs Prove Journey Mapping ROI?
Insurers need both experience benchmarks and hard operational numbers to demonstrate impact. On the experience side, J.D. Power’s digital scores offer a useful external yardstick: shopping satisfaction and service satisfaction form distinct score benchmarks, and any digital touchpoint scoring below those benchmarks is a candidate for redesign.
By the numbers: As of May 2026, 47% of new auto and home policies are purchased digitally, yet digital shopping satisfaction lags service satisfaction by 172 points. That gap alone justifies prioritizing shopping-stage fixes over service polish for many carriers.
Operational KPIs to track include first-call resolution, average handle time, time-to-settlement on claims, and portal abandonment rate at each funnel step. Business KPIs should tie directly to retention, conversion-to-bind, cross-sell attach rate, and cost-to-serve.
Design a simple before/after test: pick one journey, fix one friction point, and measure the relevant KPI for 60 to 90 days against a control group or prior baseline. That window is usually enough to see whether a fix moved the needle.
Which Tools and Integrations Actually Run the Journey?
Mapping identifies the problems, but automation is what fixes them at scale. A customer data platform resolves identity across channels, a CRM holds the relationship history, an orchestration layer decides who acts and when, and chatbots or AI assistants handle the routine interactions humans shouldn’t have to.

Integration needs a checklist to avoid gaps: identity matching across systems, a live event stream so triggers fire on real behavior, orchestration rules that route to the right channel, and reporting outputs stakeholders can actually read.
Automation patterns worth building first:
- Next-best-action prompts for agents based on recent customer behavior.
- Claim-status triggers that send proactive SMS updates before a customer calls to ask.
- Renewal nudges timed to typical shopping windows, not a single fixed date.
J.D. Power found a small portion of shoppers use virtual assistants, and those who use AI customer service for insurance agencies report much higher satisfaction. That’s the case for building AI assistants into the workflow itself.
Pro Tip: Pilot one automation workflow inside a platform like CallBack CRM before building custom integrations. Its AI-driven engagement tools already handle SMS, email, and workflow triggers, so you can test the trigger logic before committing engineering resources.
What Mistakes Derail Insurance Journey Mapping Projects?
Most failed journey mapping projects share the same root cause: they stopped at the map. A single workshop produces a colorful diagram that never connects to a system, an owner, or a budget line, and six months later nobody can say what changed.
Avoid these specific traps:
- No governance after the workshop. Assign a named owner and a review cadence, or the map becomes shelfware within a quarter.
- Broken channel handoffs. McKinsey found 6 in 10 customers switch channels before purchase, and 40% who interact with multiple people report disjointed handoffs. Track data continuity explicitly at every switch point.
- AI as a bolted-on widget. A chatbot floating in the corner of a page performs worse than an assistant woven into the workflow with context about the customer’s actual status.
- Measuring vanity metrics. Page views and workshop attendance don’t prove anything. Tie every metric to a behavior change or a dollar figure.
A Quick-Win Example: Fixing Claims Status Confusion
One recurring friction pattern shows up across carriers: customers call repeatedly just to ask “where’s my claim?” The fix follows a short, repeatable sequence.
- Detect the signal: flag claims with more than two inbound calls within five days of filing.
- Build a message template: a plain-language status update sent by SMS at each claim milestone.
- Update the portal: add a visible status tracker matching the SMS language exactly.
- Trigger the workflow: automate the SMS send the moment claim status changes in the system.
- Measure results: track repeat-call rate and average resolution time over the next 60 days.
Carriers running similar fixes typically see repeat-call volume drop noticeably within the first measurement cycle, along with faster perceived resolution even when actual settlement timelines don’t change.
What Compliance Rules Affect Insurance Journey Mapping?
Regulatory requirements shape journey maps in ways other industries never have to consider. Every touchpoint that touches underwriting, pricing, or claims decisions needs to preserve an audit trail, which means the map has to document not just what a customer experiences but what data justified each automated decision.
State insurance departments regulate communication timing and content for claims and cancellations, so any automated trigger, like the claims-status SMS from the earlier example, needs sign-off from compliance before it goes live across all states where a carrier operates. What’s permissible in one state’s unfair claims practices act may require different language in another.
Marketing communications carry their own layer: SMS and email outreach triggered by journey events must respect consent records and opt-out status at the individual level, not just the account level. A platform’s orchestration rules need to check consent status before every trigger fires, not just at the point of initial signup.
Underwriting-related touchpoints carry the heaviest documentation burden. If a journey map identifies a friction point tied to a rate quote or coverage decision, any fix that changes how that information is presented needs review to confirm it doesn’t inadvertently create disparate treatment across protected classes. Build compliance review into the pilot approval step, not as an afterthought once a fix is already live.
How Should Customer Feedback and Data Privacy Shape the Map?
Feedback data belongs in the map as a first-class input, not a footnote. Pull direct customer comments from post-claim surveys, call transcripts, and app store reviews, and tag each comment to the specific journey stage and touchpoint it describes. Patterns that show up across multiple feedback sources deserve more weight than a single complaint.
Structured feedback loops work best when they’re short and timed to the moment. A one-question survey sent immediately after a claim closes captures more honest sentiment than a lengthy quarterly survey sent weeks later.
Data privacy considerations run parallel to feedback collection. Every piece of customer data used to personalize a journey, claim history, browsing behavior, call transcripts, needs to be handled under the same consent and retention rules that govern the rest of the policyholder relationship. That means:
- Documenting what data each touchpoint collects and why.
- Confirming customers can access or request deletion of behavioral data tied to their journey profile.
- Limiting AI assistant access to only the data fields relevant to the interaction at hand, not the full customer record by default.
Treat privacy as a design constraint from the start of a mapping project rather than a legal review bolted on at the end. It’s far cheaper to build consent checks into the orchestration layer up front than to retrofit them after a pilot scales.
How Do You Personalize the Insurance Customer Journey?
Personalization in insurance works best when it’s based on behavior and life stage, not just demographic guesses. A customer who just added a teen driver to a policy has a different set of needs than one approaching a home renovation, even if they’re the same age and live in the same zip code.
Segment personalization triggers around specific events: a near-renewal window, a recent claim, a change in coverage needs signaled by a life event, or repeated portal visits to a specific coverage page. Each of those signals justifies a different message, sent through a different channel, at a different cadence.
Respect the channel preferences McKinsey documented: personalize the content, but let the customer’s demonstrated channel preference dictate delivery. A customer who always calls in for claims shouldn’t get a claims-only SMS workflow just because it’s cheaper to run.
Personalization also means restraint. Sending five different targeted offers in a single week feels less like service and more like noise. Retention marketing research consistently shows that fewer, better-timed messages outperform high-frequency campaigns on both engagement and conversion.
How Are AI and Machine Learning Changing Insurance Journey Mapping?
AI has moved from a nice-to-have chatbot to the engine that makes real-time journey orchestration possible. Machine learning models can now predict which customers are likely to call about a claim before they do, based on patterns like claim type, adjuster response time, and historical contact behavior for similar cases.

That predictive layer changes how maps get built. Instead of mapping only what happened in the past, teams can map what’s likely to happen next and design the intervention before the friction occurs. A predicted spike in claims calls triggers a proactive status update automatically, rather than waiting for the customer to initiate contact.
Natural language processing applied to call transcripts and chat logs surfaces sentiment patterns at a scale no manual review process could match, which means pain points that once took a quarter to identify through surveys can now surface within days. That speed changes the cadence of the entire mapping discipline: instead of an annual refresh, journey maps become living documents updated continuously as new data comes in.
The AI-powered engagement strategies carriers are testing now largely focus on this shift: using AI not to replace human judgment on complex disputes, but to handle the volume of routine, predictable interactions where automation genuinely improves the experience.
Why I Push Insurers to Start Small and Govern Relentlessly
Most journey mapping programs fail from ambition, not laziness. Teams try to map the entire customer lifecycle in one workshop, produce a beautiful diagram, and then wonder why nothing changes six months later. The programs that actually work start with one journey where uncertainty drives repeat contact, usually claims status, and prove measurable impact before touching anything else.
Executive buy-in comes easier when you ask for a small budget and a short deadline instead of a transformation mandate. Show a 60-day pilot with a clear before/after metric, then use that result to fund the next journey. Governance matters more than most teams expect: without a named owner and a quarterly review cadence, even a successful pilot quietly reverts to old habits within a year.
— Kyle
How CallBack CRM Helps You Run the Journey, Not Just Map It
A map only pays off once someone builds the trigger that acts on it, and that’s the gap CallBack CRM is built to close for insurance agents and agencies. Instead of handing your team a diagram and a to-do list, it gives you the automation workflows, SMS and email tools, and AI assistants to run the fixes your map identifies, without stitching together three separate platforms first.
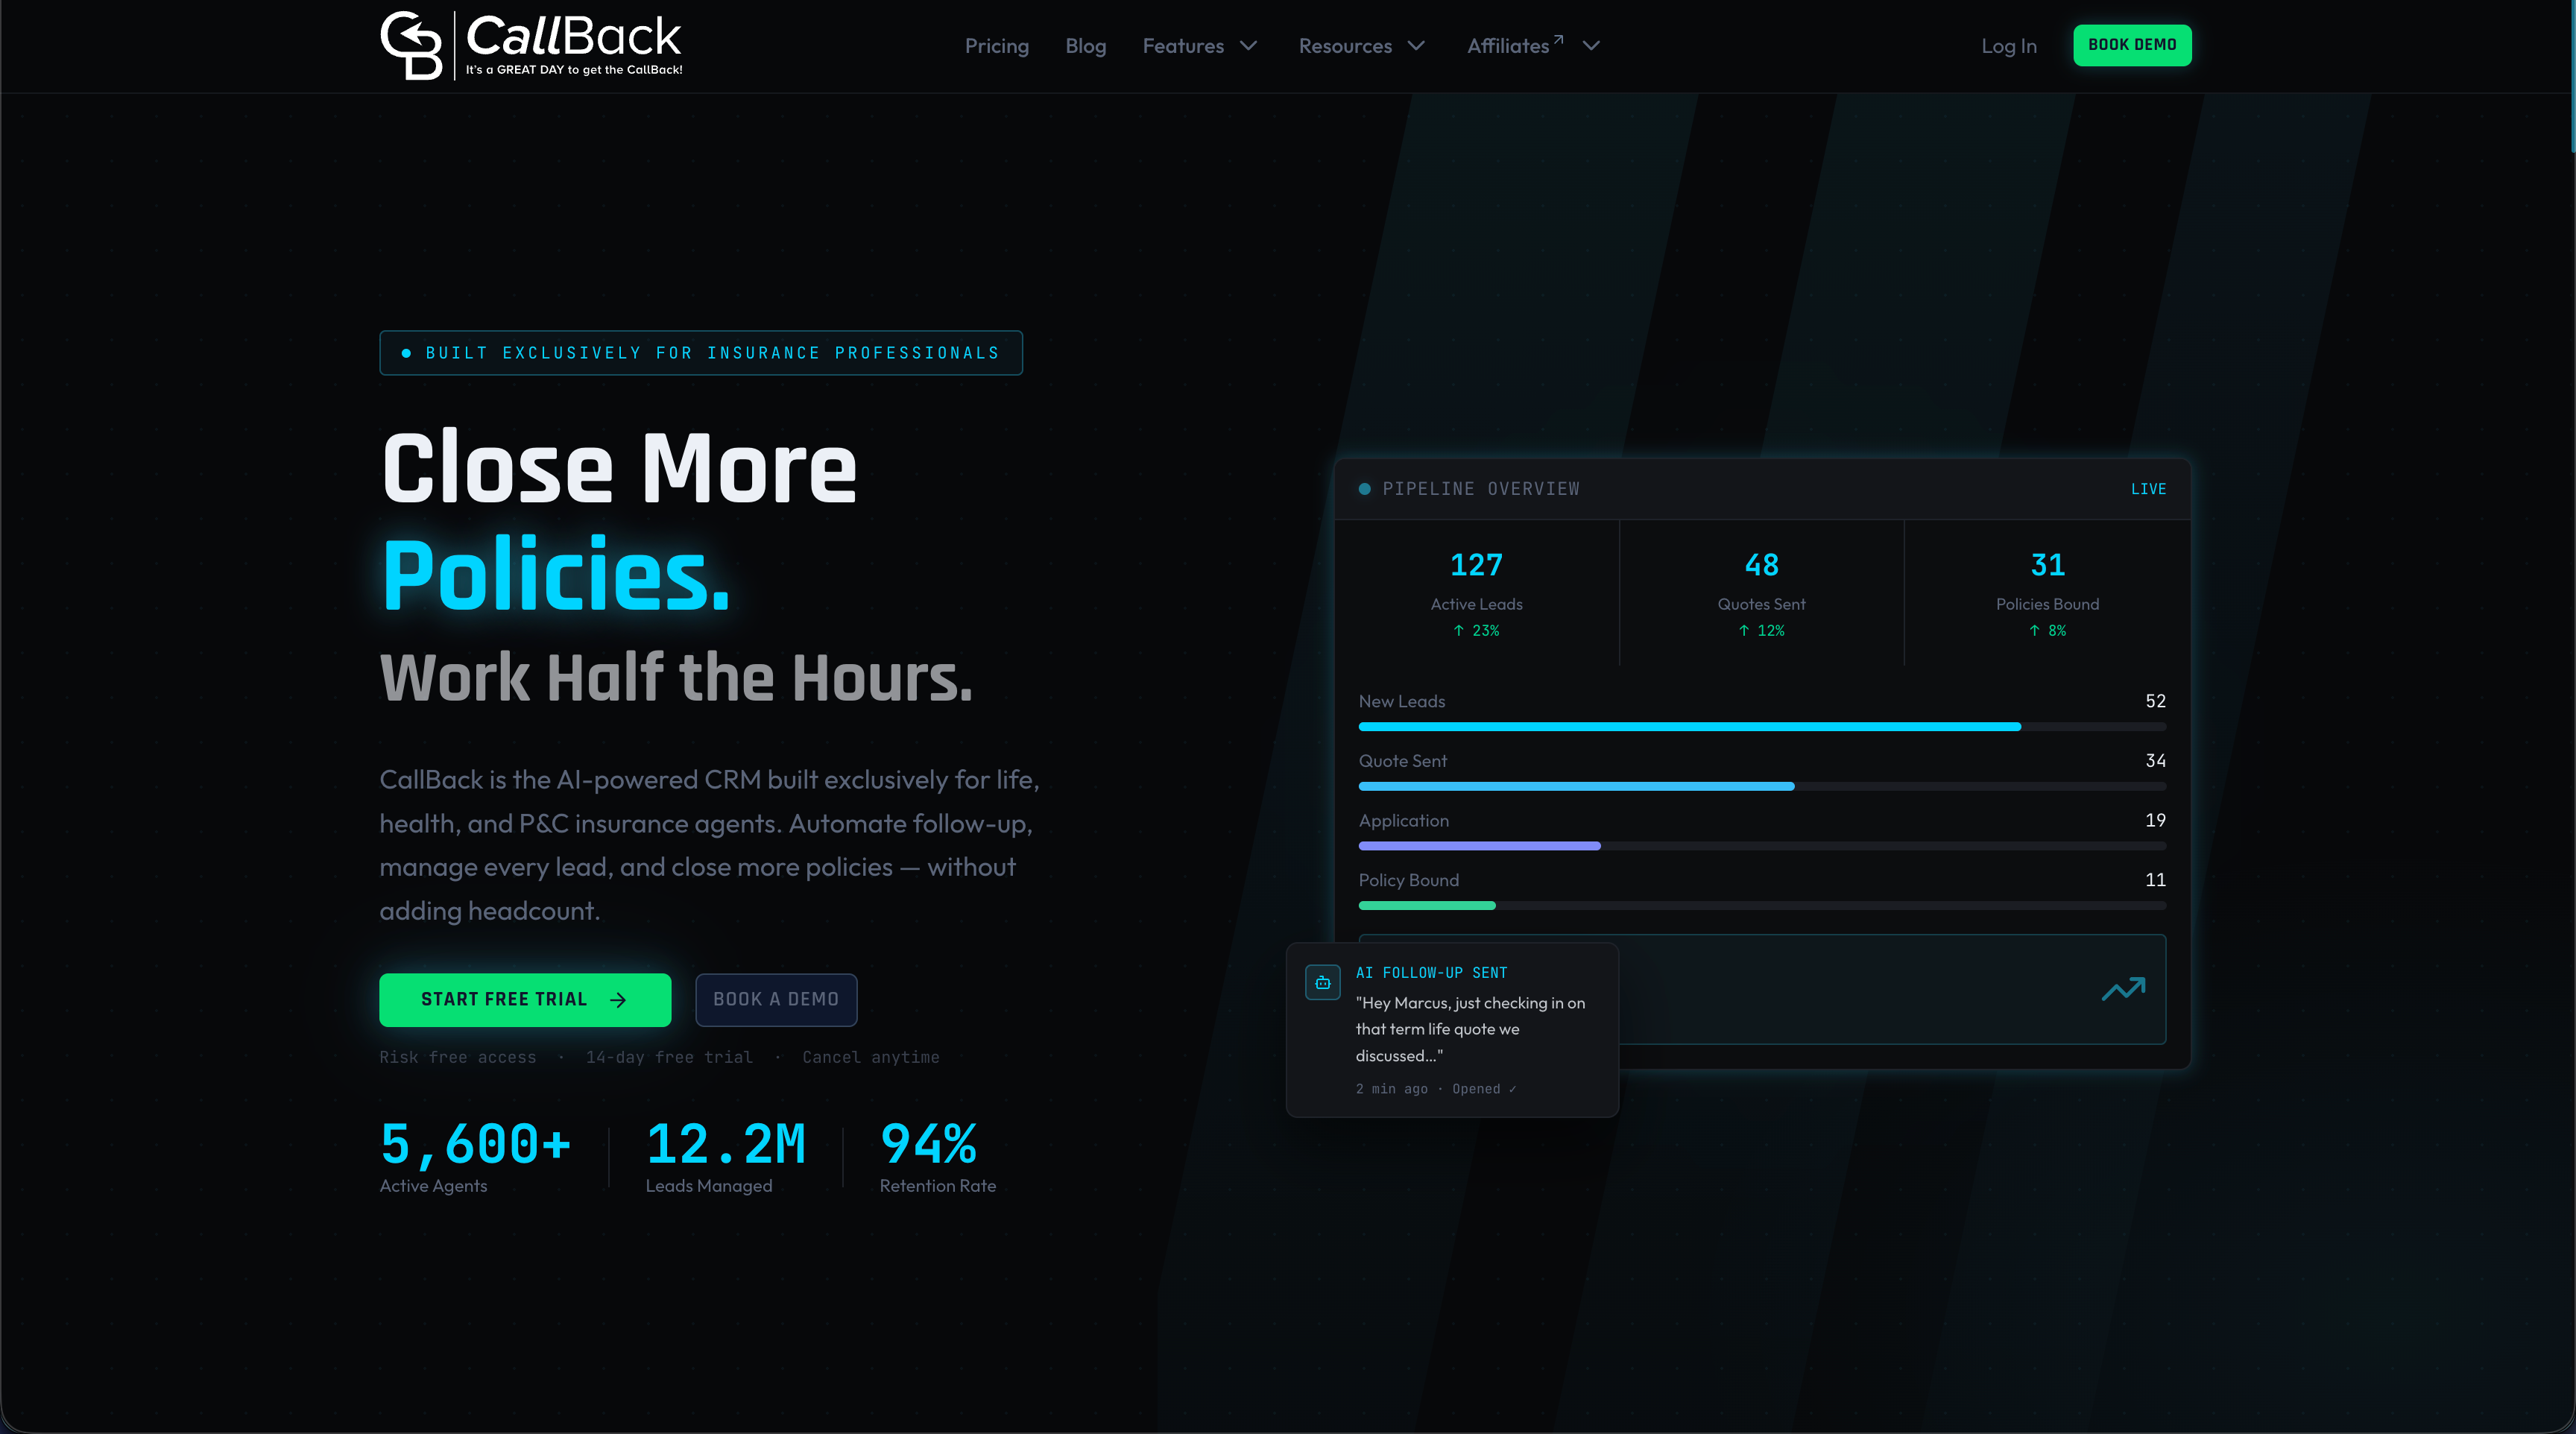
A practical starting pilot: automate claims-status notifications so customers get a proactive SMS the moment a claim milestone changes, the exact fix that tends to cut repeat calls fastest. CallBack CRM’s SMS marketing features handle that trigger logic natively, and the SMS segment calculator lets you estimate the cost of running that pilot at your book’s actual volume before you commit to it. Start a trial and map your first automated journey this week.
Sources
- 2026 U.S. Insurance Digital Experience Study — J.D. Power
- Elevating customer experience: A win–win for insurers and customers — McKinsey
- Customer Journey Management is the Best Policy for Overcoming Insurance CX Barriers — CSGI
- The Insurance Customer Experience ROI Study — Watermark Consulting