

The right starting point is CRM-captured source tracking paired with multi-touch measurement, but with one condition: before we publish any precise percentage allocation, we run identifiability diagnostics on the data. UTM tagging and lead-to-policy matching form the two building blocks that make this work. Skip the diagnostics, and the resulting numbers can mislead rather than inform.
TL;DR:
- Judge channels by bind rate, cost per approved policy, and expected loss ratio; a cheap lead can still produce an expensive policy.
- Use first or last touch only for short, direct journeys; long insurance sales involving agents, referral partners, or comparison sites need multi touch reporting.
- Capture UTMs, ad IDs, referrers, and landing pages in the CRM at lead intake, then reconcile leads against policy binds monthly.
- If channels move together and fail stability checks, do not publish point allocations; report ranges or use cohort analysis, scenario forecasts, or randomized lift tests.
Table of Contents
- Why attribution matters for insurance and how it differs from other verticals
- Attribution approaches: rule-based, multi-touch, statistical and causal methods, what to use when
- Practical measurement checklist: tagging, CRM capture, matching and governance
- Data diagnostics and limits: identifiability, collinearity and when to stop trusting point allocations
- How to implement the checklist in CallBack CRM
- Kyle’s perspective: priority roadmap for the next quarter
- Put this measurement stack to work with CallBack CRM
- FAQ
- Sources
Why attribution matters for insurance and how it differs from other verticals
Insurance marketing measurement cannot stop at cost per lead. The real question is whether a channel builds a profitable book, which means tying attribution to bind rate, cost per approved policy (CPAP), and expected loss ratio rather than lead volume alone. A campaign with a low cost per lead but a weak bind rate often costs more per policy than a campaign with a higher CPL and stronger conversion, a pattern that marketing dashboards built around CPL alone tend to hide.
Insurance also behaves differently from retail or software marketing in three ways:
- Sales cycles stretch across weeks or months, especially for life and health products with underwriting steps.
- Third-party channels (comparison sites, call centers, referral partners) frequently touch a lead before an agent does.
- Assisted conversions are common: a prospect researches online, then completes the purchase through an agent call.
These dynamics mean a single-touch view of a campaign routinely understates the channels that influence a sale early in the journey.
Attribution approaches: rule-based, multi-touch, statistical and causal methods, what to use when
Different measurement methods fit different insurance scenarios. Matching the method to the journey length and data available matters more than picking the most sophisticated option available.
- First-touch or last-touch attribution works for short, direct journeys, such as a single-session quote request that converts without agent involvement. It is simple but misrepresents assisted or multi-session paths.
- Multi-touch attribution with tunable weights fits the long, assisted journeys typical of insurance, crediting multiple touchpoints such as a paid search click, an email open, and an agent call. LIMRA’s enterprise attribution work describes moving from manual matching to automated multi-touch modeling with standardized taxonomy as the practical path for enterprise programs.
- Uplift testing and causal or Shapley-based approaches isolate the incremental effect of a channel using controlled or quasi-experimental comparisons. The Actuary’s review of causal risk attribution notes that Shapley-based allocation produces explanations conditional on a specified causal graph, useful for governance but demanding on data quality and structure.
For most agencies, the practical default is robust multi-touch modeling for day-to-day reporting, supplemented with periodic lift or experimentation studies on the highest-spend channels to confirm the multi-touch weights hold up under a controlled test.
Practical measurement checklist: tagging, CRM capture, matching and governance
A measurement program only works if the underlying data capture is consistent. The checklist below covers the operational steps that make attribution numbers trustworthy.
- Set one UTM and naming taxonomy across every form, landing page, and ad campaign, and enforce it before launch, not after.
- Push full source metadata into the CRM at the moment of lead capture: UTM parameters, ad ID, referrer, and landing page.
- Define matching rules for lead to quote to policy, combining deterministic matches (email, phone) with probabilistic matches for partial records.
- Document lookback windows by product line, since a term life quote and an auto quote rarely close on the same timeline.
- Automate a monthly reconciliation of leads against binds, and calculate CPAP, bind rate, and assisted-conversion rates from that reconciled data.
- Build a dashboard that surfaces these metrics by channel and schedule a monthly review to validate and adjust the model.
Pro Tip: Run the first reconciliation by hand before automating it, so you can confirm the matching logic catches the edge cases a script might miss.
LIMRA’s case notes describe how automated UTM capture combined with monthly validation reduced attribution errors in a long-sales-cycle insurance context. The monthly cadence matters as much as the tagging standard, since taxonomy drift and new campaign naming tend to creep in without a regular check.
Data diagnostics and limits: identifiability, collinearity and when to stop trusting point allocations

Not every dataset supports a precise attribution percentage, and treating every output as equally reliable is a common mistake. A diagnostic-first workflow described in CAS Forum research proposes testing collinearity among channels, running perturbation and stability checks, and computing a bootstrap-derived stability index before trusting a point estimate.
That diagnostic sorts results into three regimes. When the data are attribution-supported, point allocations by channel are reasonable to report. When results are borderline, we report ranges and flag the uncertainty rather than a single number. When the data are non-identifiable, meaning channels move together so tightly that no model can separate their effects, point allocations should not be published at all.
When loss triangles or marketing data lack independent structure, scenario-based reporting or aggregated metrics align communication with the real limits of the evidence, rather than manufacturing false precision.
CAS Forum
In the non-identifiable regime, cohort-level reporting, scenario-based forecasting, and randomized lift tests become the fallback. These approaches trade precision for honesty, and that trade is usually the right one.
How to implement the checklist in CallBack CRM
Every step in the checklist above maps to a specific capability inside CallBack CRM, which is why we built the platform around these workflows from the start rather than bolting measurement on afterward.
- The funnel and website builder captures UTM parameters automatically at the form level, so source data enters the system at first contact.
- CRM lead-source fields store UTM, ad ID, referrer, and landing page alongside the contact record, keeping the metadata attached through the full sales cycle.
- Automation workflows tag assisted touchpoints as a lead moves from first contact to quote to bind, building the multi-touch trail without manual entry.
- AI lead scoring flags high-value prospects early, which helps separate lead quality from lead volume when reviewing channel performance.
- Export tools pull reconciled lead-to-bind data on a schedule, supporting the monthly validation cadence the checklist calls for.
- Secure Google Cloud hosting and 24/7 support back the integrations that connect ad platforms and dialers into this workflow.
Setting this up starts with enforcing the UTM schema inside the funnel builder, mapping those fields to CRM source attributes, and scheduling the automation workflows that tag assisted steps as a lead progresses. From there, a monthly export feeds the reconciliation dashboard, and audit logs keep the governance trail intact for agencies that need to show how a number was produced.
Kyle’s perspective: priority roadmap for the next quarter

If I had to pick one place to start, it would be enforcing UTM capture and mapping it cleanly into the CRM, then running a first identifiability check before anyone presents a channel breakdown to leadership. That check alone will tell you whether your data can support precise allocation or whether you need to report ranges instead.
Over the following quarter, automate the monthly reconciliation, tune the multi-touch weights against real bind outcomes, and run at least one lift test on your highest-spend channel. Bring BI and agents into a recurring governance conversation about taxonomy, because attribution drifts the moment naming conventions get sloppy. When the data are weak, say so. Reporting an uncertainty range is more useful, and more honest, than a confident single number that collinearity has quietly undermined.
— Kyle
Put this measurement stack to work with CallBack CRM
Everything in this checklist, such as UTM capture, CRM source mapping, automated tagging of assisted touchpoints, AI lead scoring, and monthly reconciliation dashboards, can be managed within a unified CRM platform, so agencies do not have to stitch together separate tools to get a clean attribution trail.
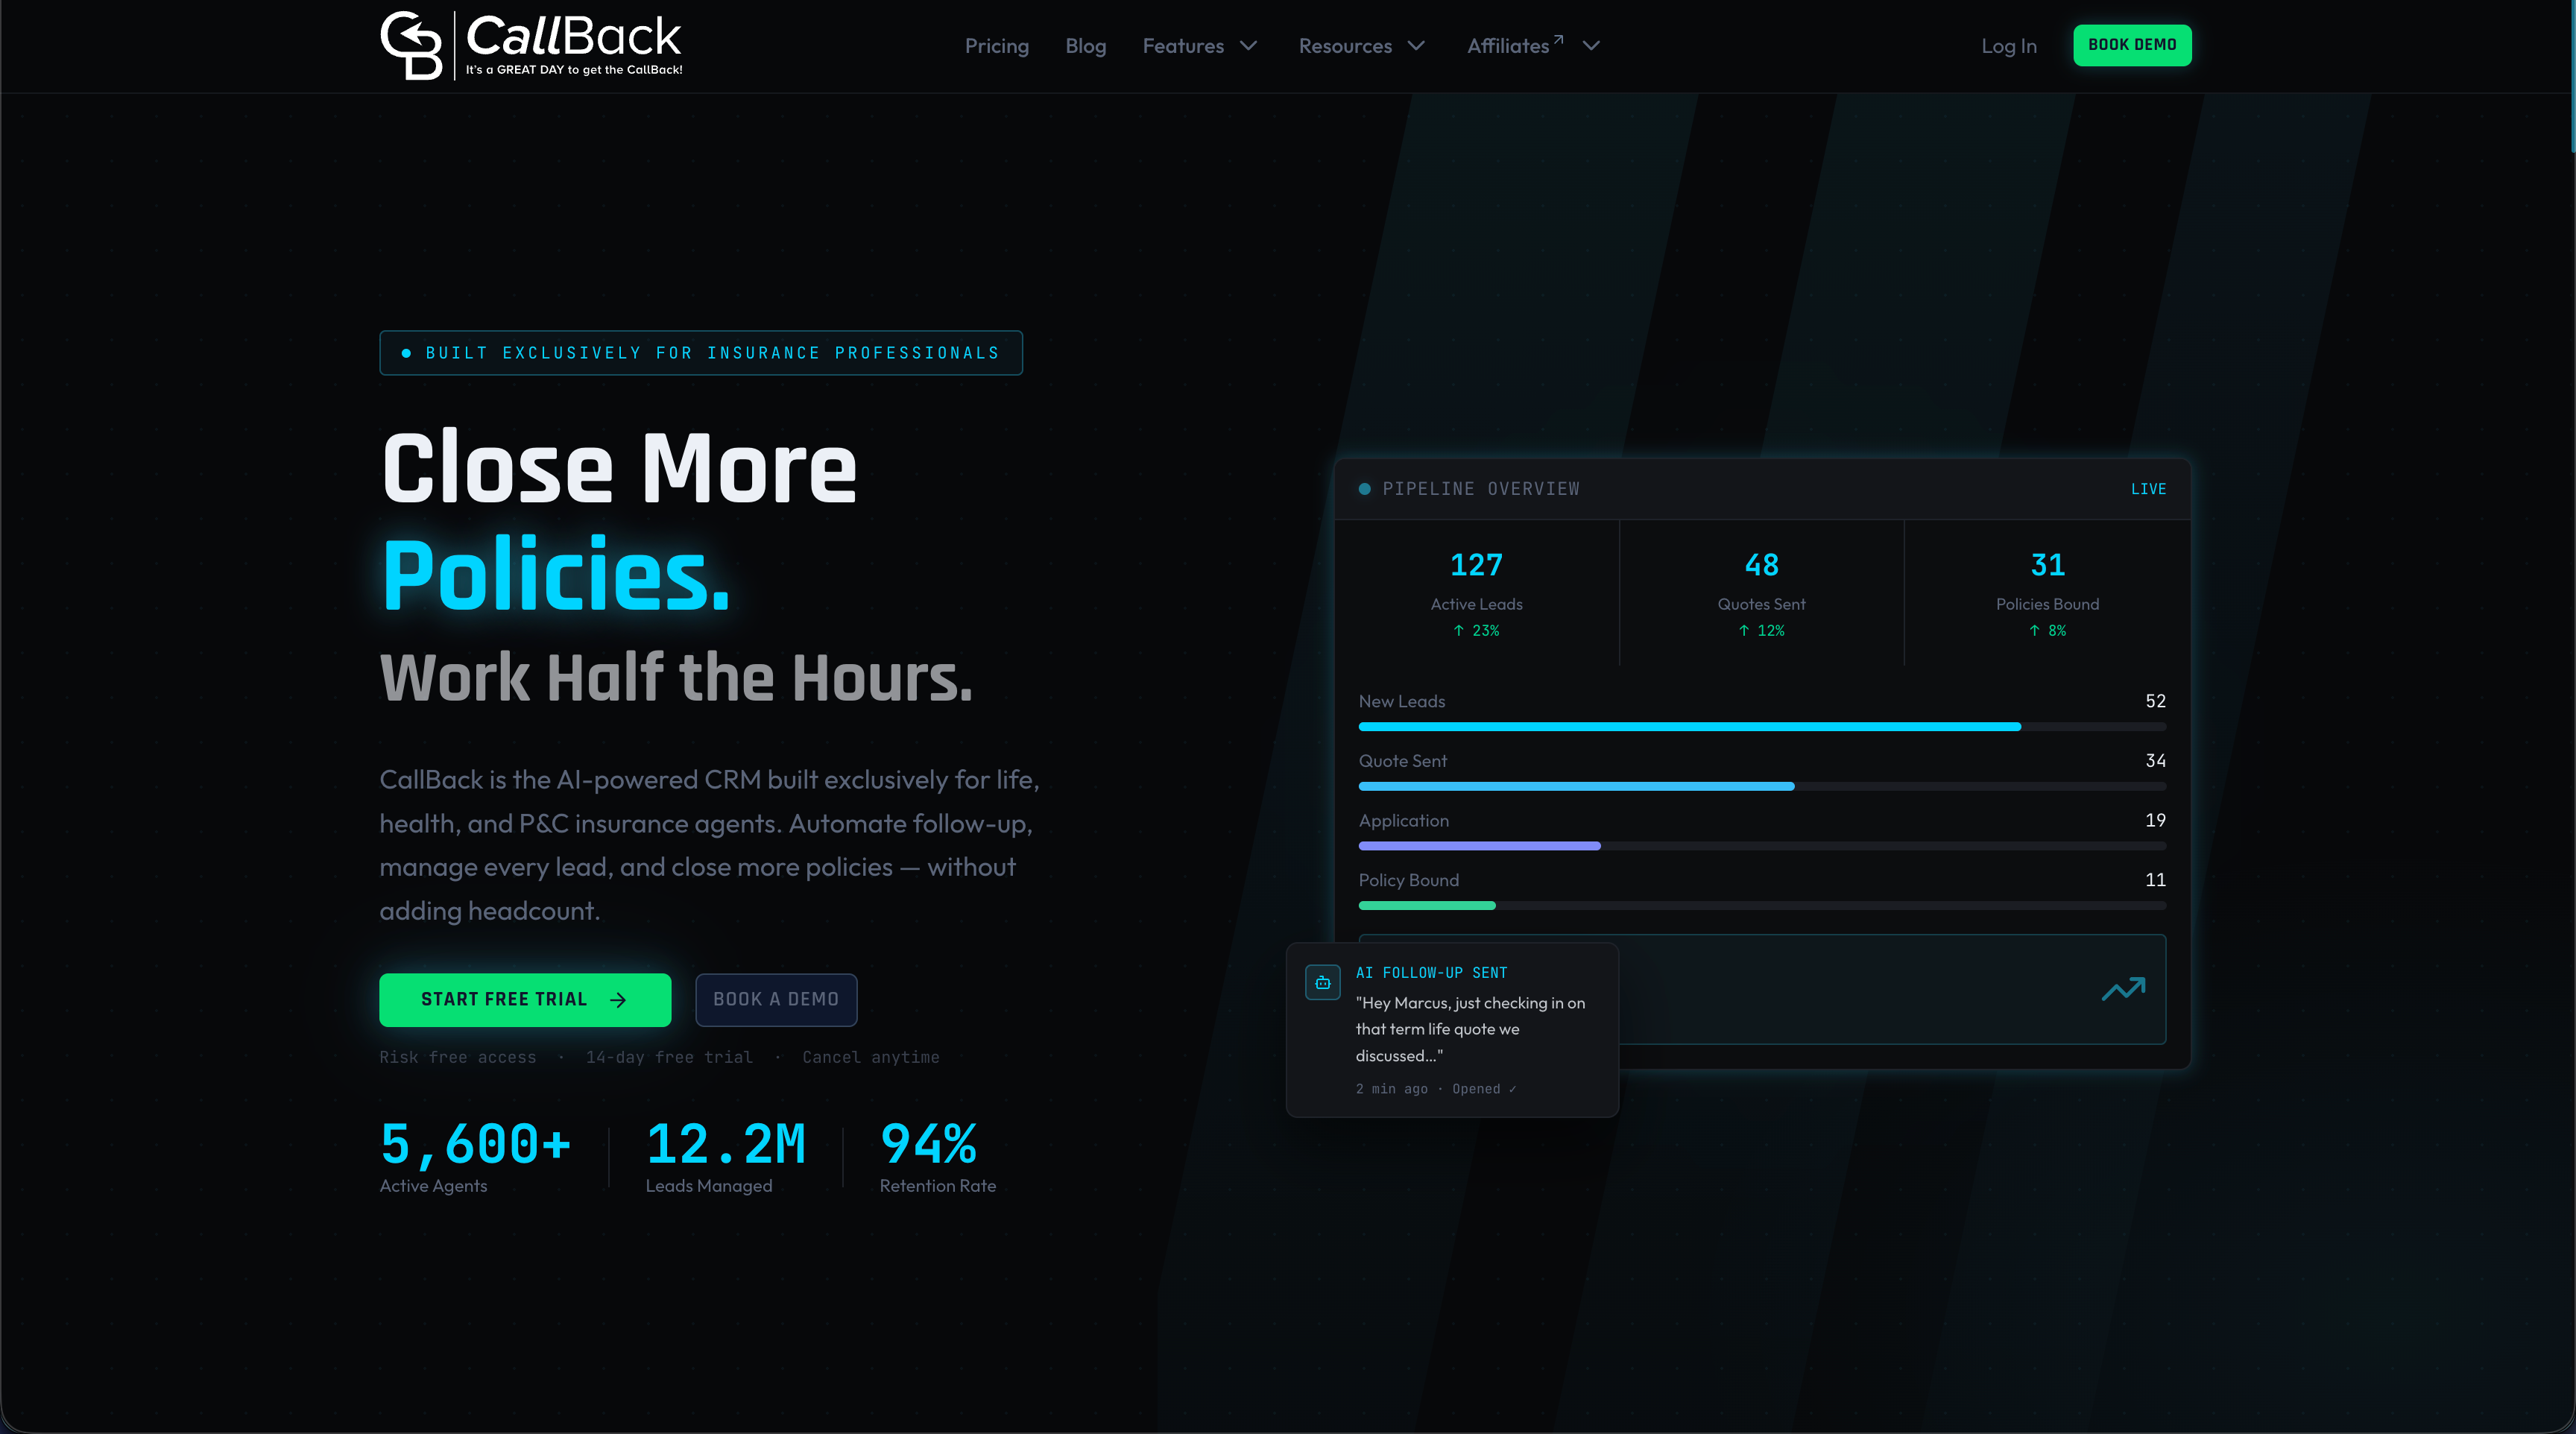
Agencies running smaller teams can start on the Professional plan at $97 per month, while multi-agent agencies and IMOs that need deeper workflow and integration capacity can review the Enterprise plans starting at $297 per month. Readers who want more detail on automation features that support lead capture can also read our guide to automating lead generation.
FAQ
How do I market my insurance business?
Effective insurance marketing combines consistent lead generation across paid, organic, and referral channels with a measurement system that ties each channel to binds, not just leads. Our guide to lead generation tips covers practical tactics for improving lead quality alongside volume.
What are the components of an insurance marketing plan?
A marketing plan for insurance typically covers target audience definition, channel selection, budget allocation, messaging and creative, and a measurement framework to track results against bind rate and cost per approved policy. Each component should connect back to the book of business the agency wants to build, not just short-term lead counts.
What are the main types of insurance agencies sell?
Insurance agencies commonly sell life, health, auto, home or property, liability, and disability coverage, with some agencies also offering business or commercial lines. The exact mix an agency markets shapes which attribution model and lookback window fit best, since life and health products close on longer timelines than auto quotes.
Why does low cost per lead sometimes signal a problem, not a win?
A low cost per lead can come from channels that attract unqualified or low-intent prospects, which shows up later as a weak bind rate. Research on marketing measurement in insurance points to tying outputs to expected loss ratio and bind quality rather than lead cost alone.
What should I check before trusting an attribution percentage?
Before trusting a channel attribution percentage, check whether the underlying data show collinearity between channels and whether a stability test confirms the allocation holds up under perturbation. The CAS Forum diagnostic workflow recommends this check before publishing any point estimate.
Sources
- Diagnosing attribution limits in loss triangles: An open-source, scenario-based reserving workflow | CAS Forum
- Prove Your Impact: Advanced Attribution for Marketing Success (LIMRA presentation)
- Uncrossing the streams: time to rethink life insurance risk attribution? | The Actuary