

Net Promoter Score measures how likely a client is to recommend your agency, and it predicts renewal and referral behavior better than a satisfaction rating alone. Independent agencies typically score in the low to mid-40s, with top-quartile agencies clearing 60 or higher. A score above 60 is strong. Below 20 signals a retention problem worth investigating now.
Your first move should not be a benchmark hunt. It should be a survey. Pull your last 60 days of closed policies and claims, send a one-question NPS survey to that cohort within 48 hours of the triggering event, and read the open-ended responses before you look at the number. The score tells you where you stand. The comments tell you why.
Key Takeaways
Agencies that pair NPS measurement with a 48-hour detractor follow-up workflow retain significantly more accounts than those that track scores without acting on them.
| Point | Details |
|---|---|
| Know your benchmark | Independent agencies average 42–48 NPS; top-quartile agencies score 62 or higher. |
| Survey at the right moment | Send transactional surveys within 2 hours post-bind and 24–48 hours post-claim. |
| Choose SMS first | SMS response rates run 32–38% versus 18–24% for email in the same window. |
| Act on detractors fast | Personal follow-up within 48 hours is the window most tied to recovered renewals. |
| Automate the workflow | Callbackcrm connects SMS survey delivery, producer task alerts, and reporting in one platform. |
Table of Contents
- What NPS for Insurance Agencies Actually Measures
- Insurance Agency NPS Benchmarks: What “Good” Looks Like
- When and How to Run NPS Surveys for Maximum Response
- Turning Detractor Feedback Into Recovered Renewals
- Mapping NPS Gains to Retention, Referrals, and Revenue
- Your 30 to 90 Day NPS Implementation Checklist
- Sources
What NPS for Insurance Agencies Actually Measures
NPS comes from one question: “On a scale of 0 to 10, how likely are you to recommend our agency to a friend or colleague?” Clients scoring 9 or 10 are Promoters. Scores of 7 or 8 are Passives. Anyone at 6 or below is a Detractor, according to the original methodology laid out in Harvard Business Review. You calculate NPS by subtracting the percentage of Detractors from the percentage of Promoters. Passives don’t count in the math, but they matter in the follow-up.
Here’s a worked example using 100 responses:
- 55 respondents score 9 or 10 (Promoters, 55%)
- 30 respondents score 7 or 8 (Passives, 30%)
- 15 respondents score 0 through 6 (Detractors, 15%)
Pro Tip: Subtract 15% Detractors from 55% Promoters and you get an NPS of 40, right in line with the independent agency average.
The number by itself is a diagnostic, not a strategy. What makes NPS actionable is the second question every survey should include: “What’s the main reason for your score?” That single follow-up turns a static metric into a list of specific, fixable problems, whether that’s a slow claims adjuster or a producer who never returns calls.
Insurance Agency NPS Benchmarks: What “Good” Looks Like
Benchmarks vary depending on whether you’re comparing yourself to a direct carrier, a national brokerage, or another independent agency, and pretending otherwise leads to bad conclusions. Independent agencies generally land between 42 and 48, while top-quartile performers push past 62, based on practitioner data compiled by BrokerageAudit. Direct carriers with large call-center operations often score lower because clients rarely interact with a dedicated human relationship, even when claims handling is efficient.
Agency size shifts the picture too. A two-producer shop with a tight client roster tends to score higher than a 40-person agency simply because personal relationships scale poorly. Commercial lines books, especially those with complex renewals, often run a few points below personal lines because the stakes and friction points multiply with policy complexity.
| Segment | Typical NPS Range | Notes |
|---|---|---|
| Independent agencies (overall) | 42–48 | Practitioner-sourced average across mixed lines |
| Top-quartile agencies | 62+ | Correlates with higher retention |
| Direct carriers | Varies by line | Often trails agencies on personal service scores |
| Small commercial books | Slightly below personal lines average | Complexity and renewal friction lower scores |
Statistic to watch: Agencies scoring above 60 retain roughly 94% of accounts annually, compared to about 72% for agencies below 30. That 22-point retention gap is the entire business case for running this program seriously.
One caution: Statista’s time-series data on U.S. insurance brokers shows scores moving gradually over the past decade, and cross-source comparisons rarely use identical survey wording or sample windows. Treat any external benchmark as a directional guide, not a precise target, and build your own baseline as soon as you can.
When and How to Run NPS Surveys for Maximum Response
Timing determines whether your survey data means anything. A relationship survey sent once a year captures a general mood. A transactional survey sent right after a specific event captures the actual cause of that mood, and the two serve different purposes.
Four trigger moments matter most for agencies:
- Post-bind: send within 2 hours of the policy being issued, while the buying experience is fresh.
- Post-claim: send within 24 to 48 hours of claim resolution, not at first notice of loss.
- Post-renewal: send within a week of the renewal being finalized.
- Annual relationship survey: send once per year to your full active book, separate from transactional triggers.
Cap frequency at one transactional survey per client event and one relationship survey per year. Surveying the same client three times in a month kills response rates and irritates the people you most need feedback from.
Channel choice changes your numbers substantially. SMS surveys sent post-bind produce response rates of roughly 32% to 38%, compared to 18% to 24% for email in the same window. Text feels immediate and takes ten seconds to answer; email gets buried. If you only have bandwidth to fix one channel decision, move your transactional surveys to SMS first.
Keep every survey to three questions maximum:
- The 0 to 10 recommendation question.
- An open-ended “main reason for your score” follow-up.
- An optional third question tied to the specific trigger (for example, “How satisfied were you with your claims adjuster?” after a claim).
Open-ended responses are where the real diagnostic value lives. A Detractor writing “my adjuster never called back” gives you a fixable operational gap. A Promoter writing “my agent remembered my renewal date without me asking” tells you exactly what to replicate across your team.
Turning Detractor Feedback Into Recovered Renewals
A Detractor score without a follow-up workflow is just a number sitting in a spreadsheet. The agencies that see retention gains treat every Detractor response as a ticket that needs an owner and a deadline, not a data point to review at the next staff meeting.
Here’s the operational sequence that works:
- Trigger an alert immediately. Any score of 6 or below should generate an automatic task assigned to the producer or CSR on the account, not a generic customer service queue.
- Call within 48 hours. Personal outreach, not a templated email, closes the loop fastest, and the 48-hour window is the point past which recovery odds drop sharply.
- Acknowledge the specific complaint. Reference the actual comment from the survey. Clients notice when you’ve clearly read what they wrote versus sending a canned apology.
- Document the resolution and re-survey in 30 days. Confirm the fix actually landed instead of assuming it did.
- Build a 90 to 120 day at-risk renewal list. Any account with a Detractor score in the past two quarters gets flagged for a producer check-in well before the renewal date, not the week it’s due.
Pro Tip: Assign detractor follow-up to the specific producer or CSR who owns the relationship, not a shared inbox. Accountability disappears the moment a task has no single owner.
Track three metrics monthly: detractor recovery rate (what percentage get resolved to a neutral or positive re-survey), time-to-first-response, and retention lift among recovered accounts versus unrecovered ones. A CRM automation can handle the alert-and-task piece automatically, which is the difference between a policy on paper and a workflow your team actually follows. Our guide to sales automation workflows for insurance agents walks through building exactly this kind of trigger.

Mapping NPS Gains to Retention, Referrals, and Revenue
The financial case for NPS isn’t abstract. McKinsey’s survey of more than 8,500 insurance customers found that carriers managing customer experience proactively outperform peers on revenue growth and shareholder returns, and the same logic scales down to agency books of business.
Run a simple model on your own numbers. Take a 500-account commercial book with an average premium of $8,000.

Pair your NPS tracking with three other KPIs on a quarterly cadence: renewal rate by producer, referral count per Promoter, and client lifetime value by score band. NPS alone tells you sentiment. These three tell you whether sentiment is actually converting into retained and expanded revenue.
Your 30 to 90 Day NPS Implementation Checklist
Before sending a single survey, get four things in place: client segmentation by product line and producer, a sample size target of at least 30 responses per segment, survey templates for each trigger moment, and a named owner for detractor follow-up. Skipping the ownership step is the single most common reason agencies collect NPS data and never act on it.
Three workflows to build in your first 90 days:
- Post-bind SMS to auto-task. New policy issues, client gets an SMS survey within 2 hours, any score under 7 auto-generates a producer task with a 48-hour SLA.
- Post-claim email to producer follow-up. Claim closes, client gets a survey within 48 hours, Detractor responses route directly to the producer with the claim number attached.
- Quarterly relationship survey to recognition loop. Full book gets surveyed once a year, Promoters get flagged for a referral ask, and top-scoring producers get recognized internally.
Minimum tech stack: a CRM capable of trigger-based automation, SMS delivery, and basic reporting dashboards. Most agencies can have the post-bind workflow live within two weeks and the full three-workflow system running inside a quarter. Our CRM workflow examples for insurance breaks down templates you can adapt directly.
Benchmarking Responsibly: Sample Size and Segmentation
A score built on 8 responses isn’t a benchmark, it’s a guess. Aim for at least 30 responses per segment before drawing conclusions, and more for agencies with over 1,000 accounts.
- Segment by product line, since personal and commercial lines rarely score the same.
- Segment by producer to identify coaching opportunities, not just agency-wide averages.
- Segment by client size, since a $500 policyholder and a $50,000 commercial account have different expectations.
- Always note the source and time period when quoting an external benchmark, since methodologies differ enough to make blind comparisons misleading.
What Actually Moves the Needle
Most agencies treat NPS as a report card. It’s closer to a smoke detector. It doesn’t tell you the building is fine, it tells you where to look first. The agencies that get real retention gains aren’t the ones with the fanciest survey tool. They’re the ones where a low score triggers a phone call inside two days, every time, without exception. I’ve seen agencies collect scores for a year and change nothing operationally, and their numbers stay flat. The moment a producer owns the follow-up personally, recovery rates move within a quarter.
— Kyle
How Callbackcrm Runs Your NPS Program for You
Building the workflow described above by hand, spreadsheet by spreadsheet, is exactly the kind of manual work Callbackcrm exists to remove. Callbackcrm is the alternative to hiring an outside CX consultant to design your feedback program: you get SMS survey delivery built into the same platform that already manages your leads, so a post-bind NPS text and its resulting producer task fire from one system instead of three disconnected tools.
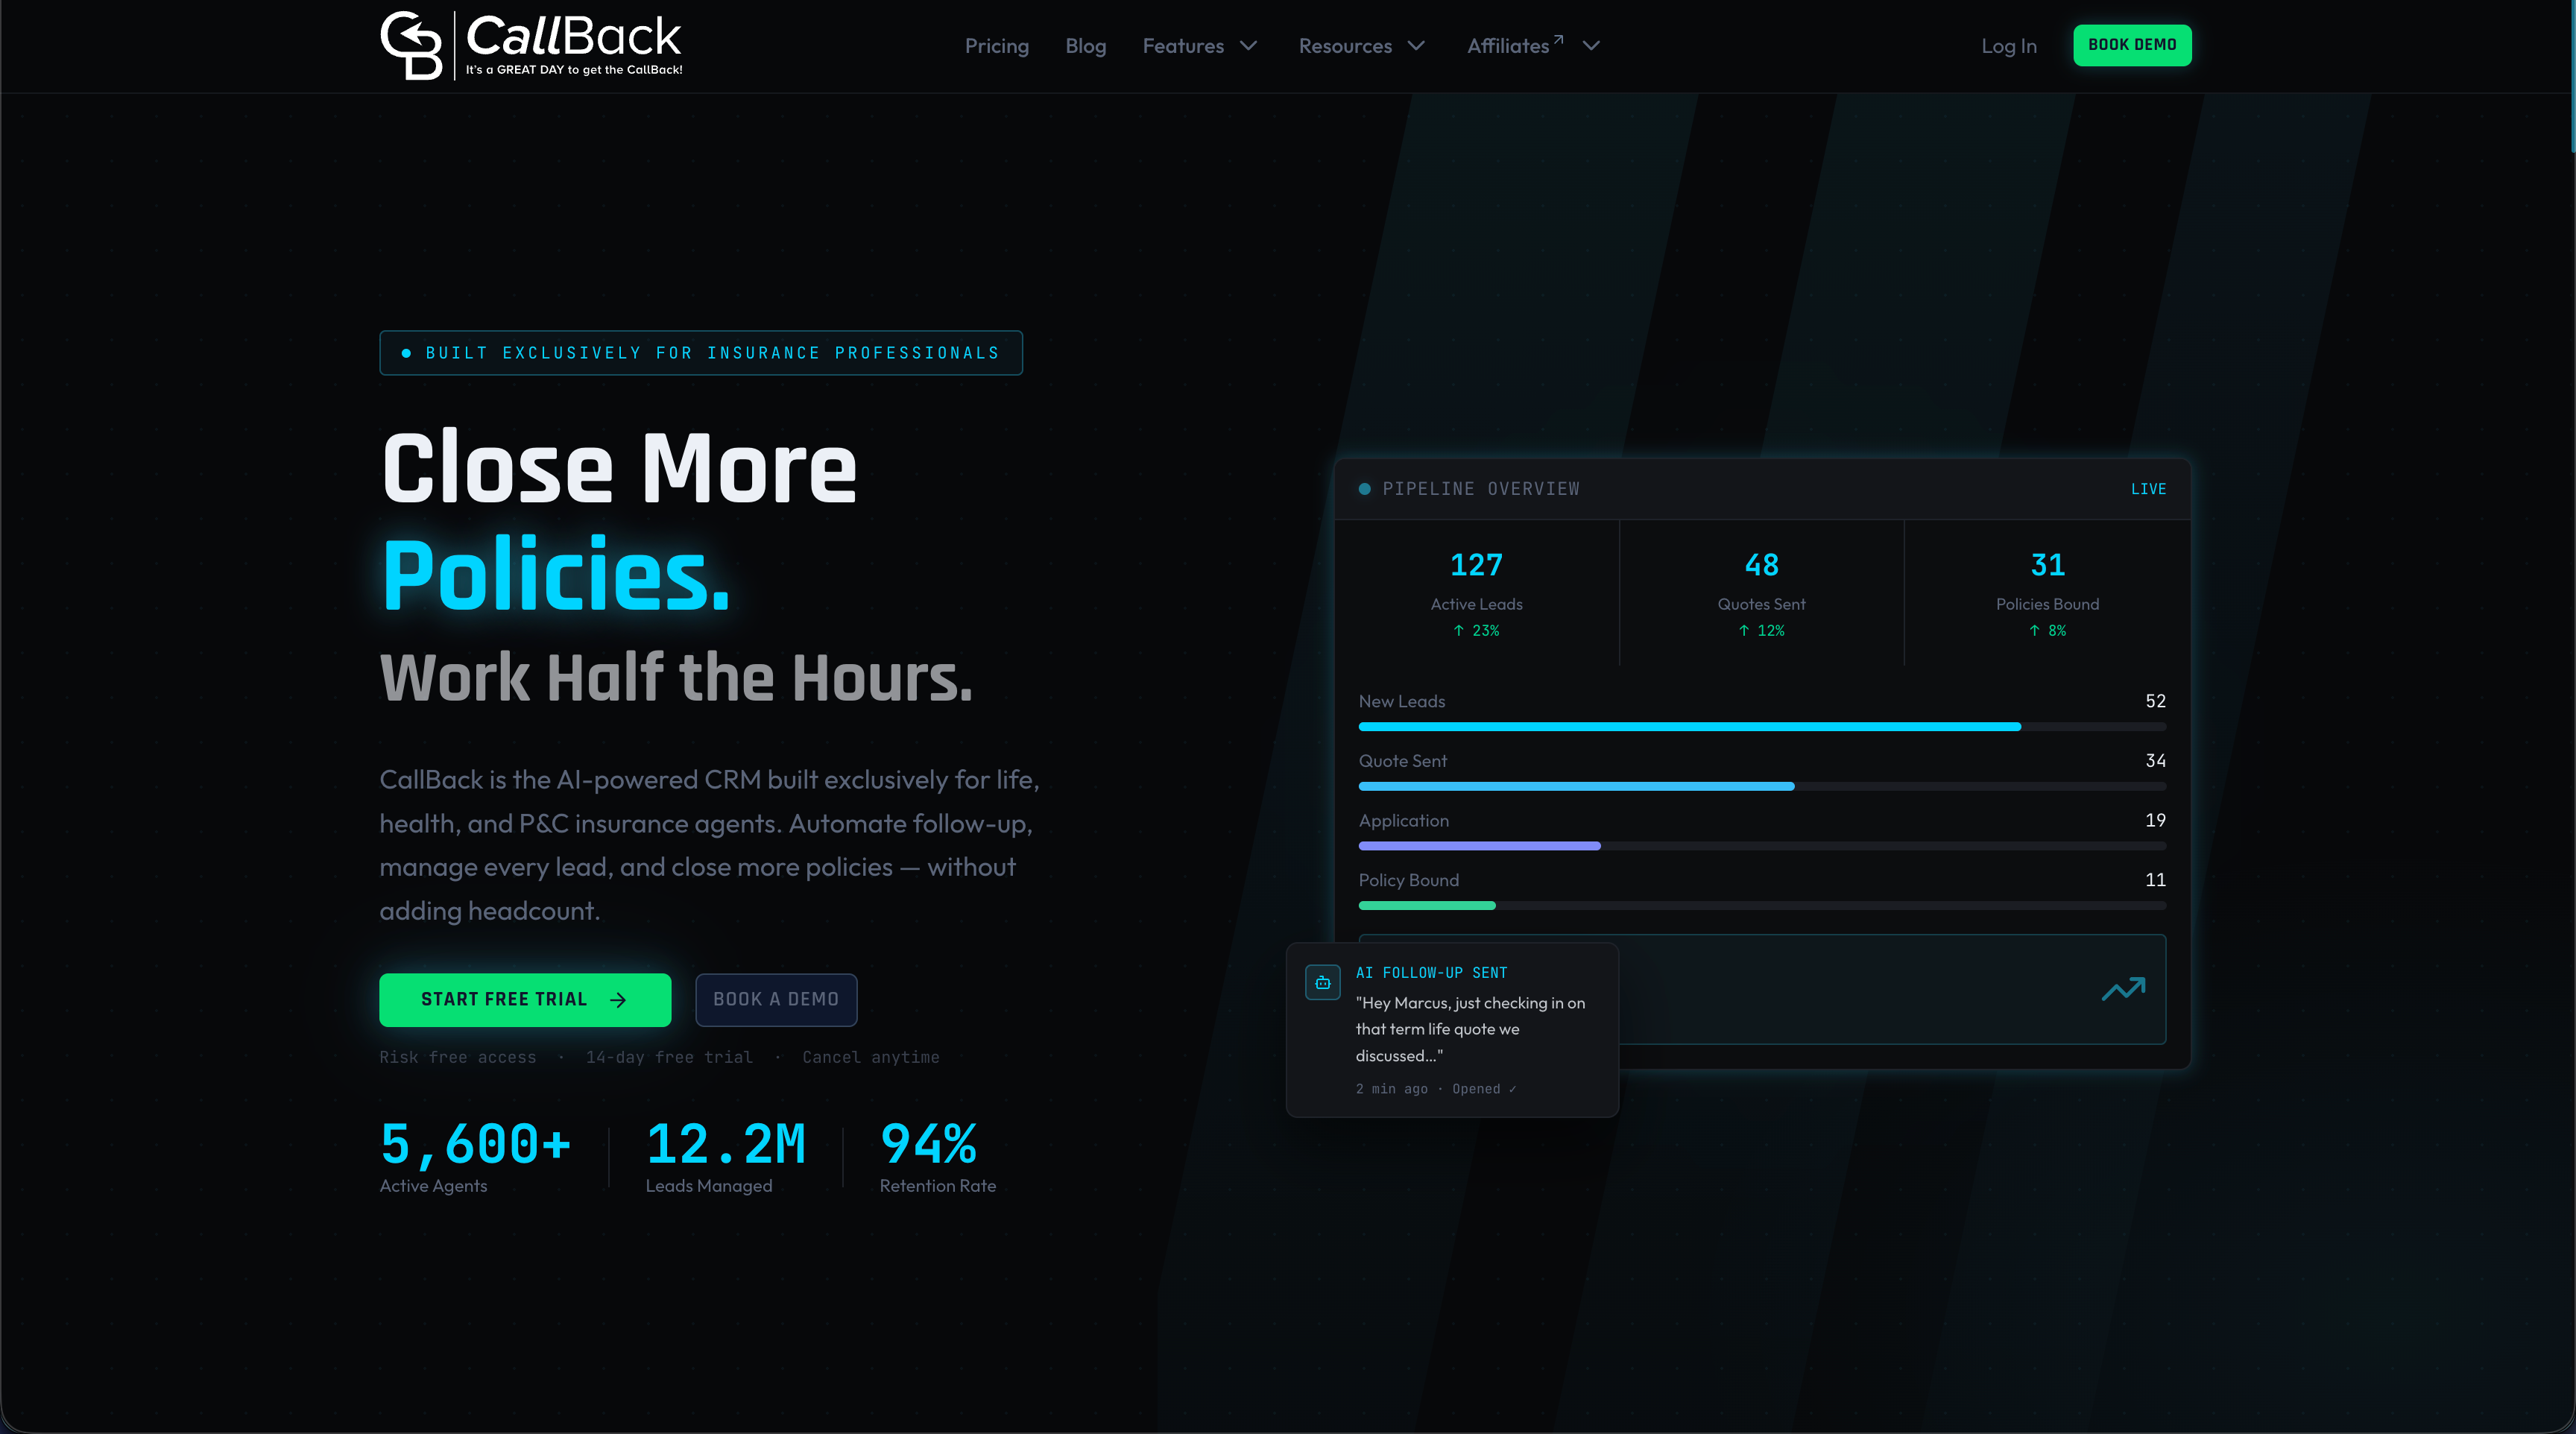
Set up your first automation, a post-bind SMS trigger that generates a task the moment a Detractor score comes in, and most agencies have it live within a week. Detractor alerts route to the right producer automatically, follow-up templates are ready to send, and reporting shows recovery rates without a manual spreadsheet. If you’re also looking to host a relationship survey or referral form, the website and funnel builder lets you spin one up without a developer. Start a trial and get your first NPS trigger running before your next renewal cycle hits.
Sources
The BrokerageAudit benchmarks anchor the agency-specific ranges cited throughout. The ACSI insurance study and JD Power’s small commercial study explain the digital and claims drivers behind score movement. Statista and Harvard Business Review provide the historical trend data and original methodology.
- Elevating customer experience: A win–win for insurers and customers — McKinsey
- NPS of insurance brokers in the U.S. 2014-2024 — Statista
- NPS and satisfaction tracking for insurance — BrokerageAudit
Recommended
- Insurance Email Sequences for Agents & Agencies: 2026 Playbook | CallBack CRM Blog
- Managing Agency Social Media Accounts: A 2026 Playbook | CallBack CRM Blog
- Why Nurture Insurance Leads: The Case for Follow-Up Discipline | CallBack CRM Blog
- Broker Client Retention Strategies for Insurance Agents | CallBack CRM Blog