

Six reports drive most of the measurable gains in an insurance agency’s CRM: pipeline velocity, lead-source ROI, agent activity, retention risk, cross-sell opportunity, and commission reconciliation. Together they shorten sales cycles, protect renewal revenue, and catch reconciliation losses before they compound. The first action is simple: schedule a recurring 30-minute weekly report review with the owner or lead producer.
TL;DR:
- Tracking pipeline velocity helps prevent deals from stagnating by setting stage thresholds and escalating delays to managers immediately.
- Regular review of lead-source ROI enables shifting budget away from underperforming channels to improve overall conversion efficiency.
- Monitoring agent activity scores and routing retention risks proactively supports coaching efforts and prevents renewal losses before they happen.
- Accurate commission reconciliation requires verifying policies marked as bound actually funded and ensuring split matches producer agreements consistently.
- Building a daily dashboard with policies bound, retention rate, and carrier concentration allows quick identification of systemic issues and risk exposure.
Table of Contents
- Six revenue-driving CRM reports and what to do with each
- Key metrics and dashboard design for insurance agency CRM reporting
- How to get clean, usable data into your reports
- Turning reports into action: cadence, playbooks, and accountability
- Example implementation with an insurance-focused CRM and analytics workflow
- Author perspective: prioritize process over feature-hunting
- Piloting CallBack CRM to put this reporting playbook into practice
- FAQ
- Sources
Six revenue-driving CRM reports and what to do with each
A report only matters if it triggers an action. Here is what each of the six should show and the single move it should prompt.
- Pipeline velocity tracks how long a lead sits in each stage, from quote to bind. Set a threshold per stage (say, 5 days in “quoted”) and auto-escalate any deal that exceeds it to the producer’s manager.
- Lead-source ROI requires three fields on every lead: acquisition cost, conversion count, and resulting premium; see this marketing automation checklist for practical steps to automate lead-source ROI tracking. Review the report monthly and shift budget away from sources with conversion rates below the agency average.
- Agent activity scorecard counts calls, quotes issued, and policies bound per producer per week. Pair low activity with coaching, not just a warning, since coaching tied to a specific metric changes behavior faster than a general reminder.
- Retention risk dashboard flags renewal lag, missed payments, and open claims as early warning signals. Route flagged accounts to a dedicated outreach queue before the renewal date, not after.
- Cross-sell opportunity report surfaces clients who hold only one policy type when their profile suggests more, a gap sometimes called wallet-share. Time outreach to follow a claim resolution or a life event noted in the CRM, when clients are most receptive.
- Commission reconciliation compares what carriers pay against what the agency books. Watch for the two most common errors: policies marked bound that never funded, and commission splits that do not match the producer agreement on file.
Agencies that build short, consistent client communication into these reports tend to see better retention outcomes. A survey of nearly 1,200 independent agency principals and staff found that proactive monthly communication was linked to stronger retention, which is exactly the kind of signal the retention risk report should be forcing into action every week rather than once a month.
Pro Tip: Attach one report to one owner. A report nobody is accountable for becomes a spreadsheet nobody opens.

Key metrics and dashboard design for insurance agency CRM reporting
A dashboard is only useful if a manager can read it in under a minute and know what to do next. The core KPIs worth putting on screen are policies bound, premium volume, retention rate, quote-to-bind ratio, producer growth, and carrier concentration.
- Policies bound and premium volume show raw output and should be viewed by week and by producer, not just agency-wide.
- Retention rate should sit next to renewal count so a manager can see whether a dip is isolated or systemic.
- Quote-to-bind ratio exposes whether the problem is lead quality or closing skill.
- Producer growth tracks new business per producer over time, useful for spotting who is ramping and who has plateaued.
- Carrier concentration flags overexposure to a single carrier, a risk factor worth monitoring alongside production numbers.
A four-part business intelligence model built for insurance agencies groups these pieces into predictive analysis, dashboards and scorecards, visualization for “why” questions, and database reporting for “what happened,” according to an industry presentation on underwriting profitability. That structure is a useful way to sort which of the KPIs above belong on a daily dashboard versus a monthly deep dive.
Real-time dashboards suit metrics that change daily, like pipeline velocity and agent activity. Scheduled snapshot reports fit slower-moving numbers, like carrier concentration or quarterly retention trends, where a weekly or monthly pull is accurate enough.
None of this matters if the inputs are wrong. Before trusting a dashboard number, check that producer IDs and carrier codes are mapped correctly and spot-check a sample of policies against the source system each month.
How to get clean, usable data into your reports
Reports are only as good as the data feeding them, and insurance agencies typically pull from four systems: the agency management system (AMS), the CRM, the quoting platform, and carrier statements. Each needs specific fields extracted: policy number, premium, effective date, and producer ID at minimum.
- Decide between live sync and scheduled exports. A live API connection keeps dashboards current but requires more setup; a nightly AMS export is simpler to maintain and still current enough for weekly review.
- Map fields once, carefully. Producer IDs and carrier codes are the two fields most likely to break downstream reporting when mismatched, so verify these before trusting any report built on top of them.
- Validate with a reconciliation sample. After the first sync, compare a 30-day sample of policies against carrier statements to catch mapping errors early.
- Automate the refresh. Manually rebuilding spreadsheets each week invites errors; an automated refresh cycle removes that risk.
An analytics layer that runs directly on AMS exports can produce carrier concentration, producer growth, and retention dashboards without migrating off the existing AMS. Book Analytics, for example, works with exports from systems like HawkSoft, Applied Epic, EZLynx, AMS360, and Jenesis, which means agencies can get trend-aware reporting without replacing the system of record. Practitioner guidance echoes the same caution: agencies that rely on an “export-and-pray” workflow, where data is pulled once and never refreshed, tend to find their numbers stale within weeks. The fix recommended by Agency Performance Partners is to prioritize live dashboards or, where that is not feasible, a nightly export paired with a simple normalization step.
Turning reports into action: cadence, playbooks, and accountability
A report that nobody discusses changes nothing. The weekly review should run 30 to 60 minutes and move through the six reports in order: pipeline velocity, lead-source ROI, agent activity, retention risk, cross-sell opportunity, and commission reconciliation.
Build decision rules into the meeting so discussion turns into action automatically:
- Any deal older than the stage threshold gets escalated to a manager the same day.
- Any lead source falling below the agency’s average conversion rate loses budget allocation at the next monthly review.
- Any account flagged for renewal lag or a missed payment gets a outreach call scheduled within 48 hours.
Tie a portion of short-term incentive, not long-term production goals, to specific report-driven behaviors like SLA adherence on follow-up speed. That kind of near-term link between behavior and reward tends to accelerate adoption faster than tying everything to year-end numbers, a pattern noted in research on agency communication habits.
Pro Tip: Review the same six reports in the same order every week. Consistency in the ritual matters as much as the numbers themselves.
Pro Tip: If a report hasn’t changed a decision in a month, either the data is wrong or nobody owns the follow-up.
Readers building out producer-level accountability can find template workflows in CRM workflow examples built for insurance agencies.
Example implementation with an insurance-focused CRM and analytics workflow
A CRM built specifically for insurance work should handle the reporting load without requiring a separate business intelligence tool bolted on afterward. At minimum, agencies should expect a few capabilities from a specialized platform:
- AI-assisted follow-up that triggers based on pipeline stage, not just a static calendar reminder.
- Multi-channel outreach, covering calls, SMS, and email, logged automatically into the same record.
- Direct AMS integration or export support, so producer and carrier data flows into reporting without manual re-entry.
- Built-in dashboards for the core reports, rather than requiring a separate spreadsheet rebuild each week.
A CRM built for insurance agents, agencies, and IMOs can automate follow-up across SMS, email, and voicemail and centralize outreach data that feeds directly into the kind of reports described above. A practical way to test this is a small pilot: pick a cohort of two or three producers, sync their AMS data, and run a four-week review cycle measuring pipeline velocity and agent activity before expanding agency-wide. Agencies evaluating automation tools for this kind of pilot can review a broader rundown in AI marketing tools built for insurance agencies.
Author perspective: prioritize process over feature-hunting

The agencies that get the most out of CRM reporting are not the ones with the most dashboard widgets. They are the ones with clean data and one person responsible for the weekly review. Most reporting failures trace back to messy producer IDs, not a missing feature.
Start small: fix data hygiene, assign one owner to the weekly cadence, and pilot with a handful of producers before rolling out agency-wide. Measure whether behavior actually changed, not just whether the report got opened.
— Kyle
Piloting CallBack CRM to put this reporting playbook into practice
CallBack CRM maps directly onto the six reports above: automated multi-channel follow-up feeds the pipeline velocity and agent activity reports, while centralized lead data supports lead-source ROI tracking without manual entry. For an agency ready to pilot this, the practical path is to start small and measure results over a few weeks before expanding to the full team.
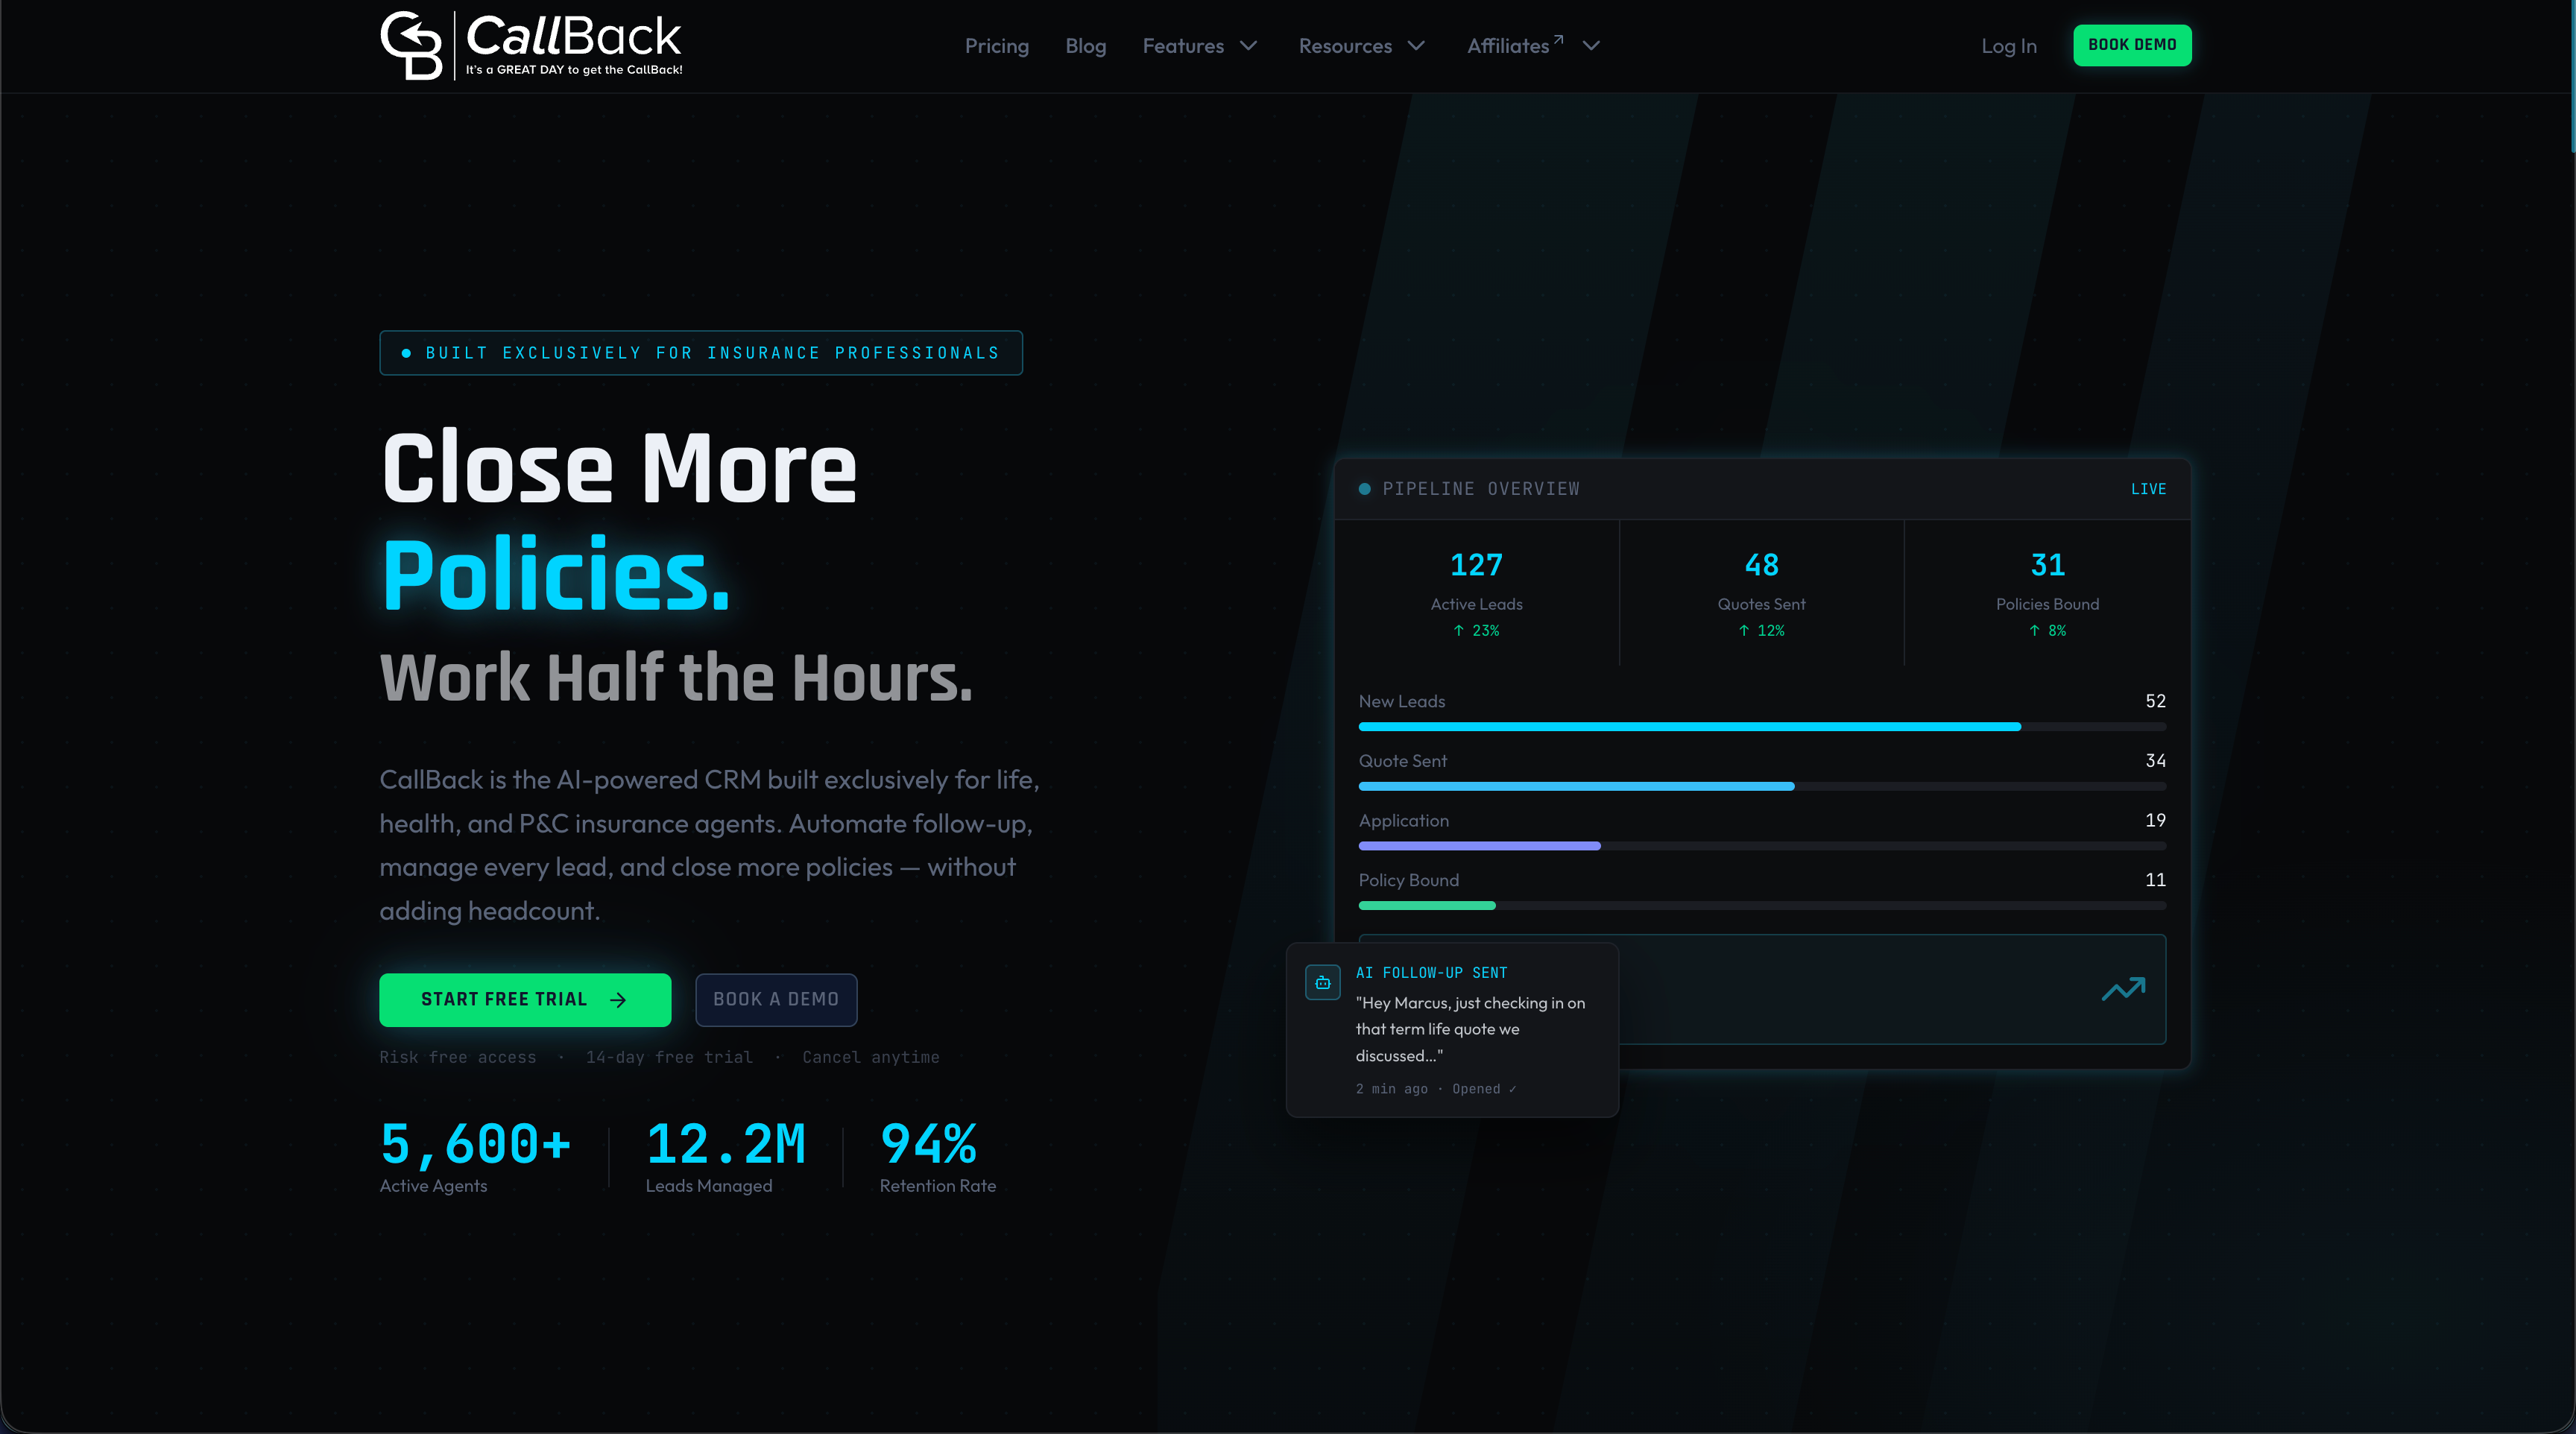
Agencies that want to test the workflow directly can start with the Professional plan at $97 per month. Larger agencies running multiple producer accounts can review multi-seat options on the Enterprise signup page, which covers deployments from 10 to 60 full CRM accounts.
FAQ
What CRM do insurance agents use?
Insurance agents use a mix of general-purpose CRMs and insurance-specific platforms, with the specialized tools typically offering built-in AMS integration and automated multi-channel follow-up. CallBack CRM is one example built specifically for insurance agents, agencies, and IMOs.
What are some examples of CRM reports?
Common examples include pipeline velocity reports, lead-source ROI reports, agent activity scorecards, retention risk dashboards, cross-sell opportunity reports, and commission reconciliation reports. Each is designed to trigger a specific action rather than just display a number.
What is CRM in the insurance industry?
In insurance, a CRM is the system that tracks leads, policies, client communication, and renewal activity in one place. It becomes the source data for reporting on sales performance, retention risk, and producer activity.
What are the four main types of CRMs?
CRMs are generally grouped into operational, analytical, collaborative, and strategic types, though definitions vary by source. In practice, most insurance agencies use a platform that blends operational functions, like tracking leads and policies, with analytical reporting built on top.
Sources
- Habitual, actionable communication key to rebuilding trust | Triple-I Blog
- Book Analytics for Insurance Agencies | OpSpring
- What insurance reports should your agency be using? | Agency Performance Partners