

TL;DR:
- Most organizations struggle to operationalize data-driven decision making despite high interest levels. Implementing a structured six-step framework and fostering accountability improve decision quality and organizational learning. Combining the right tools, clear questions, and human judgment creates a disciplined approach that drives measurable business outcomes.
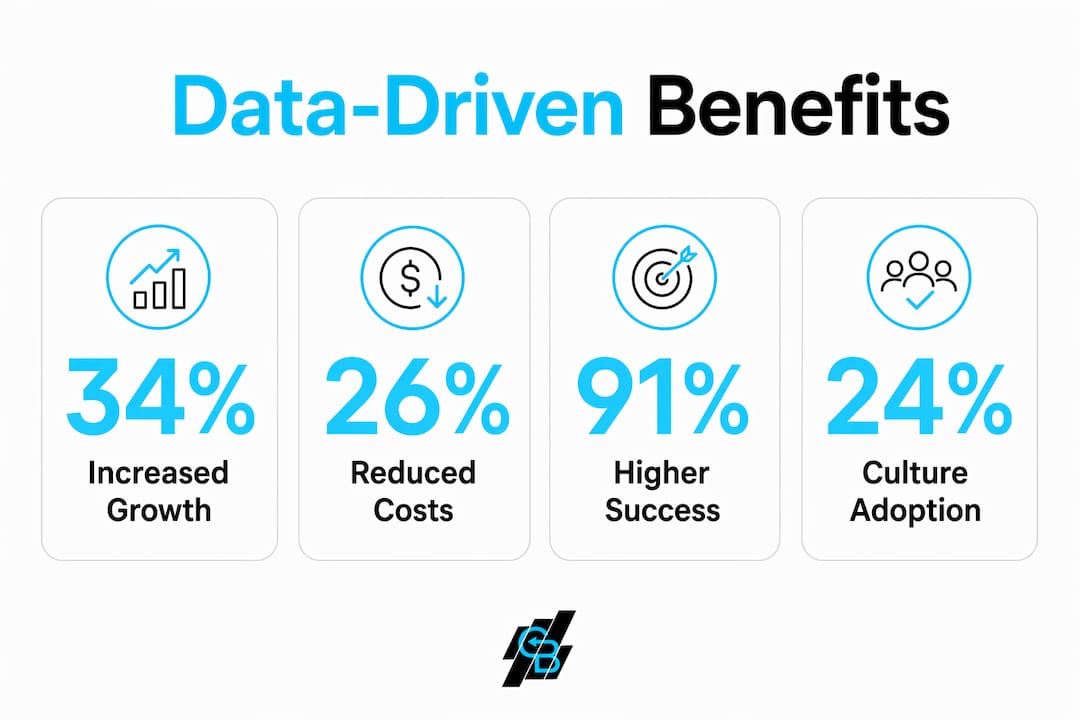
Data-driven decision making is defined as the practice of using concrete data, analytics, and measurable evidence as the primary basis for business decisions rather than intuition or past experience. The industry term for this practice is evidence-based management, and both terms describe the same discipline. Only 26% of companies successfully operationalize it, even though 91% say they want to. That gap is where most organizations lose their competitive edge. Tools like Salesforce, Tableau, and CRM platforms sit at the center of data-driven decision making explained in practice, turning raw numbers into decisions that move revenue.
What is data-driven decision making, really?
Data-driven decision making explained in plain terms means replacing gut calls with a structured process that starts with a question and ends with a documented outcome. The goal is not to collect more data. The goal is to collect the right data and act on it with confidence.

Fewer than 24% of Fortune 1000 firms have a genuine data-driven culture. That number reveals how rare true adoption is, even among the largest companies in the world. Most organizations have dashboards. Far fewer have a repeatable process for turning those dashboards into decisions.
The distinction between descriptive and prescriptive analytics matters here. Descriptive analytics tells you what happened. Diagnostic analytics explains why it happened. Prescriptive analytics recommends what to do next. Moving beyond descriptive data to diagnostic and prescriptive analytics is where real decision value is unlocked. Most businesses stop at descriptive and wonder why their data efforts feel unproductive.
Understanding data-driven decisions also means recognizing what they are not. They are not about removing human judgment. They are about giving human judgment a factual foundation to stand on.
What does an effective decision-making framework look like?
A reliable 6-step framework covers every phase from problem definition to outcome measurement. Skipping any step degrades the quality of the final decision. Here is how each step works in practice:
- Define the problem. Write a specific, decision-oriented question. “Why did Q1 churn increase 8% among mid-market accounts?” is a good question. “How are we doing?” is not.
- Identify data sources. Map the CRM records, product analytics, survey responses, or financial reports that hold relevant signals.
- Clean the data. Remove duplicates, fix formatting errors, and flag missing values. Tools like Python’s pandas library or Alteryx handle this at scale.
- Analyze and visualize. Use business intelligence platforms like Tableau, Power BI, or Looker to surface patterns. Visualization makes findings communicable to non-technical stakeholders.
- Decide and document. Record the decision, the evidence behind it, and the person accountable for execution. Documentation is what separates a data-driven culture from a data-aware one.
- Measure and iterate. Set a review date. Compare outcomes against the original hypothesis. Adjust the approach based on what the data shows.
Pro Tip: Frame your question before you touch any data. Vague questions produce unusable data, while clear, decision-oriented questions yield insights you can act on immediately.
The framework works because it creates accountability at every stage. When a decision fails, you can trace exactly which step broke down. That traceability is what makes the process repeatable and improvable over time.
What are the measurable benefits of this approach?
The importance of data-driven decision making becomes clear when you look at specific outcomes rather than general claims. Objective data reduces risk by replacing biased intuition with evidence-based choices, which directly improves decision accuracy and business outcomes.
One concrete example: a SaaS company that redesigned its onboarding flow based on product analytics reduced time-to-first-value from 12 to under 5 minutes, resulting in a 15% increase in day-7 activation by the end of Q2. That result came from a single, well-framed question about where new users dropped off. The data pointed to a specific friction point, and the fix was targeted rather than speculative.
Data-driven strategies for businesses across industries produce consistent advantages:
- Reduced decision risk. Evidence replaces assumption, cutting the likelihood of costly missteps.
- Faster alignment. Shared data creates a common language for cross-functional teams, reducing debate over opinions.
- Improved ROI on marketing spend. Analytics in marketing drives measurably better ROI when campaigns are built on behavioral data rather than demographic guesses.
- Stronger customer retention. CRM data reveals churn signals early, giving teams time to intervene before a customer leaves.
- Scalable growth. Decisions built on repeatable data processes scale with the organization rather than depending on individual expertise.
“An insight that does not lead to action is a waste of effort.” This principle from Kissmetrics captures why data collection alone is never enough. Every analysis must end with a clear recommendation.
What challenges and misconceptions block success?
The most common failure in understanding data-driven decisions is confusing data access with data culture. Having a dashboard is not the same as making data-driven decisions. Dashboards often create an illusion of data-driven behavior while actually producing decision paralysis because they show information without recommending action.
Other pitfalls that derail organizations include:
- Confirmation bias. Analysts who start with a conclusion and work backward to find supporting data undermine the entire process. Testing 5–8 hypotheses simultaneously reduces this bias and produces more reliable insights.
- Data overload. Collecting every available metric without a guiding question creates noise. More data is not better data.
- Ignoring context. A number without context misleads. A 20% drop in website traffic means something different during a site migration than during a normal operating week.
- Treating data as final. Data reflects the past. Human judgment must interpret what it means for the future.
Pro Tip: Adopt a data-informed approach rather than a purely data-driven one. Combining data with human experience produces better decisions than rigid reliance on numbers alone, especially in ambiguous or fast-moving situations.
The difference between data-driven and data-informed is not semantic. Data-driven implies the data decides. Data-informed means the data advises, and a human decides with full context. Most leaders benefit from the second model.
How do you implement data-driven strategies that actually stick?
Practical implementation of data-driven strategies for businesses requires three things: a closed-loop system, the right tools, and a culture of documentation. Each element reinforces the others.
A closed-loop system documents every decision alongside the evidence that supported it and the outcome it produced. This creates organizational memory. When a similar decision comes up six months later, you are not starting from scratch. You are building on tested knowledge.
The table below maps common business functions to the tools and data types that support evidence-based decisions in each area:
| Business Function | Primary Tool | Key Data Type | Decision Example |
|---|---|---|---|
| Sales | CRM (e.g., Salesforce) | Pipeline velocity, win rate | Prioritize accounts with highest close probability |
| Marketing | BI platform (e.g., Tableau) | Campaign conversion rates | Reallocate budget to top-performing channels |
| Customer Success | Product analytics | Feature adoption, churn signals | Trigger proactive outreach at drop-off points |
| Operations | ERP system | Cost per unit, cycle time | Identify process bottlenecks for cost reduction |
| HR | HRIS + survey tools | Engagement scores, turnover rate | Redesign onboarding to improve 90-day retention |
Integrating data with human judgment is the final and most underrated step. The best analysts at firms like McKinsey and Bain do not just present findings. They present findings with a recommended decision and a rationale. That combination of evidence and interpretation is what moves organizations forward.
For insurance professionals specifically, data-driven insurance marketing offers a direct path to applying these principles to lead generation and client retention. The same framework applies: define the question, collect the right data, analyze it, and act on the recommendation.
Pro Tip: Set a 30-day review cadence for every major decision. Reviewing outcomes against your original hypothesis is how you build a learning organization rather than a reactive one.
Key takeaways
Data-driven decision making succeeds when organizations combine a structured framework, the right tools, and a closed-loop system that documents decisions and measures outcomes consistently.
| Point | Details |
|---|---|
| Define the question first | Vague questions produce unusable data; precise questions yield decisions you can act on. |
| Use the 6-step framework | Define, source, clean, analyze, decide, and measure. Skipping steps degrades output quality. |
| Avoid the dashboard trap | Dashboards show information but rarely recommend action; build processes that end in decisions. |
| Balance data with judgment | A data-informed approach outperforms rigid data-only reliance in complex, fast-moving situations. |
| Close the loop | Document every decision and its outcome to build organizational memory and improve over time. |
Where most organizations get this wrong
The honest reality about how to make data-driven decisions is that most organizations treat it as a technology problem when it is actually a discipline problem. I have watched companies invest heavily in Tableau licenses, Snowflake data warehouses, and Power BI dashboards, then make the same gut-call decisions they always made. The tools did not change the behavior.
What actually changes behavior is accountability. When a decision is documented, with the evidence behind it and the person who made it, the quality of that decision improves immediately. Nobody wants their reasoning on record if it is weak. That social pressure is more powerful than any analytics platform.
The other mistake I see constantly is treating data-driven decision making as a destination rather than a practice. There is no finish line. The organizations that do this well, firms like Amazon and Capital One, treat every decision as a hypothesis and every outcome as feedback. They are not more intelligent than their competitors. They are more disciplined.
For insurance agencies and IMOs, the stakes are especially high. Prospect data, policy renewal signals, and engagement patterns are all available. The agencies that act on that data systematically will outperform those that rely on agent intuition alone. The gap between those two groups is widening every year.
The future of this practice runs through AI and real-time analytics. Waiting for a monthly report to make a decision will feel as outdated as a fax machine within five years. The organizations building those real-time feedback loops now are the ones that will set the pace.
— Kyle
How Callbackcrm puts data to work for your agency
Callbackcrm is built for insurance professionals who want to stop guessing and start deciding based on real evidence. The platform connects CRM data, lead scoring, email and SMS engagement, and campaign analytics into one system, so you always know which prospects are ready to buy and which campaigns are driving results.
Every feature in Callbackcrm is designed to close the loop between data collection and action. AI-powered lead scoring identifies high-value prospects automatically. Automated workflows trigger outreach based on behavioral signals. Reporting tools show you exactly which efforts are producing revenue. Explore the full suite of AI-powered features and see how Callbackcrm turns your data into decisions that grow your book of business.
FAQ
What is data-driven decision making in simple terms?
Data-driven decision making is the practice of using concrete data and analytics to guide business decisions rather than relying on intuition or guesswork. The goal is to frame a precise question, collect relevant data, analyze it, and act on the findings.
Why do so many companies fail at data-driven decision making?
Only 26% of companies successfully operationalize data-driven decisions despite 91% wanting to. The most common reasons are vague question framing, dashboard overload, and a lack of documented accountability for decisions.
What is the difference between data-driven and data-informed?
Data-driven implies the data alone decides the outcome. Data-informed means data is a key input alongside human judgment and context. Most leaders perform better with a data-informed approach because it accounts for factors the data cannot fully capture.
What tools support data-driven decision making?
CRM platforms like Salesforce, business intelligence tools like Tableau and Power BI, and product analytics platforms like Mixpanel are the most widely used. The right tool depends on the business function and the type of decision being made.
How do you avoid confirmation bias in data analysis?
Test multiple hypotheses at the same time rather than looking for data that confirms a single assumption. Testing 5–8 hypotheses simultaneously is a proven method for reducing bias and uncovering the true causes behind a business outcome.